
Off-market real estate deals offer buyers less competition and better pricing – often 8% to 15% below market value. But finding these hidden opportunities requires smart use of historical data. By analyzing property records, owner patterns, and neighborhood trends, investors can identify motivated sellers before properties are publicly listed.
Key insights include:
- Tax delinquencies, liens, and expired listings often signal financial or personal distress.
- AI models now predict seller likelihood with 70%-80% accuracy, analyzing over 200 data points.
- Absentee owners and long-term property holders are prime off-market targets.
- Neighborhood signals like code violations and loan maturity dates highlight untapped opportunities.
Investors can use scoring models and data stacking to rank properties by off-market potential. This approach not only saves time but also improves deal outcomes by focusing on high-probability leads. By refining workflows and leveraging tools like skip tracing and live data feeds, sourcing off-market deals becomes a repeatable, efficient process.
How Buyers Find Off Market Homes Using Real Estate Data #shorts
sbb-itb-8058745
Key Historical Data Types for Predicting Off-Market Opportunities
Successful off-market strategies hinge on three main types of data: property and transaction records, owner and occupancy patterns, and neighborhood trends. Each offers unique insights into identifying motivated sellers and untapped opportunities.
Property and Transaction Records
The backbone of any property analysis is the Assessor’s Parcel Number (APN) – a unique code that ties all public records to a specific property. Using the APN, you can access tax assessments, deed transfers, mortgage records, and lien filings to piece together a property’s financial history.
Certain records are particularly telling. For instance, pre-foreclosure filings like Notices of Default (NOD) and Lis Pendens often indicate owners under financial pressure who may need to sell quickly. Similarly, lien records (e.g., tax liens, mechanic’s liens, judgment liens) can highlight financial distress that might not yet appear in foreclosure data. Even MLS history can be revealing – not for active listings, but for those that failed, such as expired or withdrawn listings, where owners attempted to sell but couldn’t close the deal traditionally.
Other clues include unfinalized building permits, which may point to stalled renovation projects or failed flips. Life events, such as probate filings or divorce proceedings, are also key. By 2025, over 40% of motivated seller activity was driven by life events, with divorce accounting for 15% and estate transitions for 13%.
"Motivation is about circumstance, not just finances." – BatchData
Owner and Occupancy Patterns
When a property owner’s mailing address differs from the property address, it’s often a red flag. Absentee owners, especially those living out of state, are less emotionally tied to a property and more likely to entertain off-market offers. Cross-referencing tax records for mismatched addresses can quickly generate a focused list of potential leads.
Migration trends also play a role. Between December 2025 and February 2026, 30% of homebuyers nationwide searched for homes in different metro areas. Cities like Los Angeles (net outflow of 31,200), New York (24,600), and Seattle (18,000) saw significant population shifts during this period. Owners managing properties remotely in these high-outflow areas often prefer a straightforward, off-market sale over a traditional listing process.
Another key metric is Days on Market (DOM). In Texas, the median DOM reached 82 days in March 2026, a 12-day increase from the previous year. Properties that linger unsold often lead to "tired sellers", who may be more willing to entertain off-market offers.
Neighborhood and Market Trends
Taking a broader view at the neighborhood level can help pinpoint areas worth targeting. For example, a high number of expired MLS listings in a specific zip code may indicate a disconnect between seller expectations and market realities, creating opportunities for off-market deals. Similarly, clusters of municipal code violations or stalled construction projects often signal fatigued owners or underperforming properties.
In the commercial market, loan maturity dates are a goldmine of insight. When refinancing conditions are unfavorable, property owners nearing the end of their loan term may look to sell off-market as an exit strategy. Tax appeal history is another useful indicator – areas with frequent property tax appeals often reveal owners who feel their properties are overvalued and might sell before conditions decline further.
The table below highlights key neighborhood-level signals and their predictive value:
| Neighborhood Signal | Predictive Value | Data Source |
|---|---|---|
| Expired MLS Listings | High (failed traditional sale) | MLS History |
| Code Violations | High (owner fatigue/neglect) | Municipal Records |
| Loan Maturity Dates | High (refinancing pressure) | Mortgage Databases |
| Rising Carrying Costs | Medium (financial friction) | Utility/Tax Records |
| Tax Appeal History | Medium (owner dissatisfaction) | County Assessor |
Modern investors rarely rely on a single data point. Instead, they use data stacking – combining multiple filters like high equity, vacancy, and out-of-state ownership to pinpoint the most promising leads. This layered approach transforms a broad list of property owners into a precise, actionable target set.
These neighborhood-level signals set the stage for converting historical data into predictive features in the following section.
Converting Historical Data Into Predictive Signals
Turning raw historical data into actionable insights involves a structured process. By analyzing property records and neighborhood trends, this data is refined into predictive signals through three key steps: defining seller profiles, building predictive features, and scoring properties based on their off-market potential.
Defining Likely Off-Market Sellers
The first step is identifying property owners who are most likely to sell off-market. This involves focusing on data that highlights seller motivation. Historical transaction patterns and major life events – like divorce, estate transitions, job relocations, and retirement – are powerful indicators. These life events are linked to over 74% of off-market transactions.
Building Predictive Features
Once the likely seller profile is defined, the next step is to combine multiple data points to strengthen predictions. Each additional signal boosts confidence in the likelihood of a sale. Predictive features typically fall into four main categories:
| Feature Category | Key Data Points |
|---|---|
| Financial Readiness | High equity (50%+), loan-to-value (LTV) under 50%, long ownership tenure (30+ years), tax delinquency |
| Ownership Patterns | Absentee ownership, tenure exceeding 10 years, changes in entity structure, portfolio-level activity |
| Property Condition | Code violations, deferred maintenance, permit history, vacancy |
| Behavioral Signals | Tax assessment appeals, changes in management companies, listing other assets in the same portfolio |
For example, a single-property listing within a multi-asset portfolio might indicate a larger liquidation is underway.
To assess financial readiness, use this formula:
Estimated Equity = AVM Value − Mortgage Balance.
Properties with high equity are often owned by sellers more willing to accept discounted cash offers, making them prime targets.
With these features in hand, the next step is prioritizing properties based on their off-market potential.
Scoring Properties by Off-Market Potential
Predictive features are used to develop scoring models that rank properties by their likelihood of selling within 12 months. These propensity-to-sell models analyze more than 200 data points per property, achieving accuracy rates of 70% to 80%, compared to 50% to 55% with random selection.
For those not using machine learning, a simpler rules-based approach can still work. Assign point values to distress or motivation signals, and rank properties by total score:
| Distress Signal | Point Value |
|---|---|
| Pre-foreclosure | +10 points |
| Tax Delinquency | +8 points |
| Vacant Property | +5 points |
| Out-of-State Owner | +3 points |
| High Equity | +2 points |
Regardless of the approach, data accuracy is critical. Outdated or incorrect records can lead to wasted efforts and missed opportunities. Before contacting leads, cross-reference scored properties with current county recorder records to ensure accuracy.
Investors who rely on well-calibrated, data-driven sourcing methods often acquire properties at prices 8% to 15% below market value compared to publicly listed deals.
"Propensity models don’t just count signals; they understand the complex interplay between them." – BatchData
Building a Repeatable Off-Market Deal Sourcing Workflow
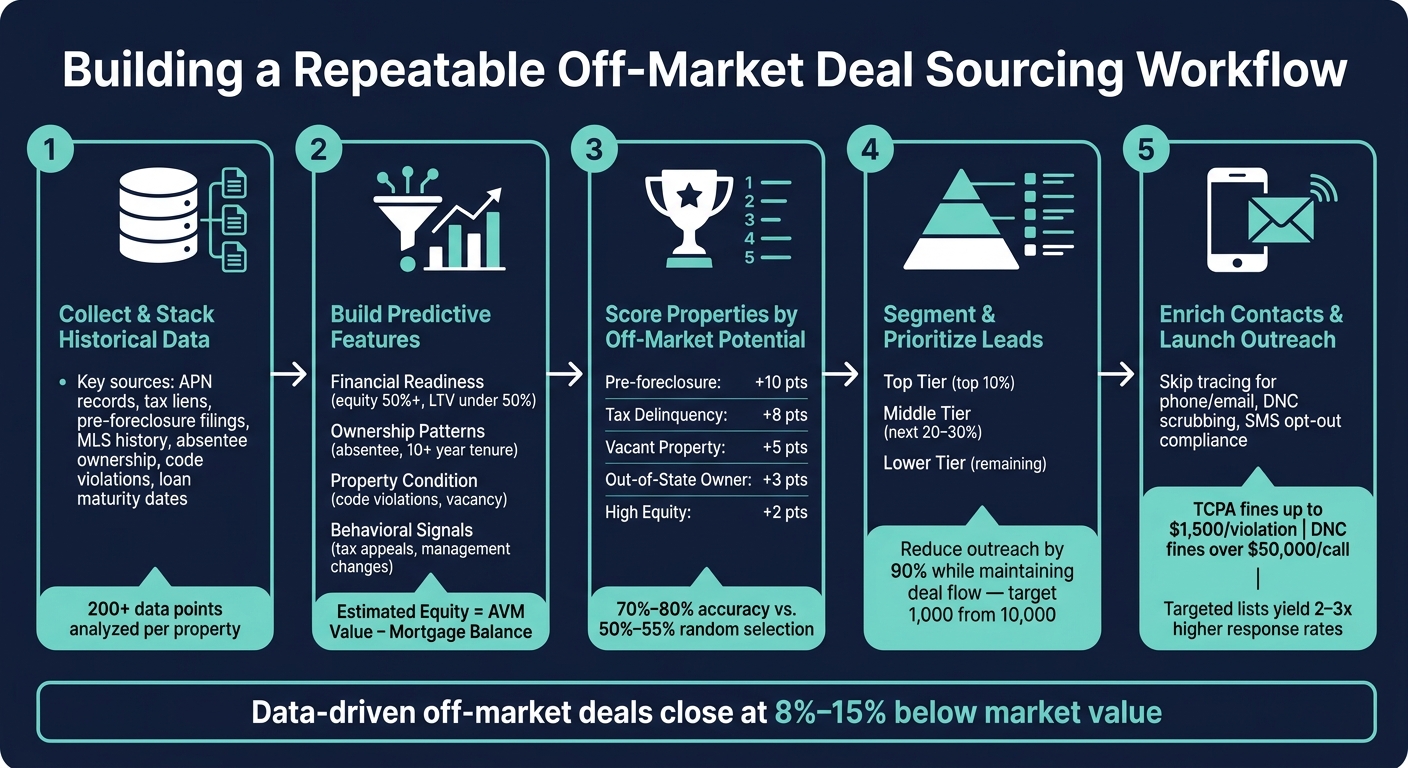
How to Find Off-Market Real Estate Deals Using Historical Data
Once you’ve established a scoring model, the next step is turning those scores into a reliable, repeatable process. The goal? To move smoothly from raw data to closed deals without having to rebuild your workflow every time.
Segmenting and Prioritizing Target Properties
Not every high-scoring property deserves the same level of attention. Start by dividing your list into tiers for targeted outreach. For example:
- Top Tier: The highest-priority properties, roughly the top 10%.
- Middle Tier: The next 20–30% of properties.
- Lower Tier: The remaining properties.
Begin outreach efforts with the top-tier group. This focused approach can significantly boost efficiency. Instead of blanketing 10,000 homes with outreach, you can narrow your efforts to around 1,000 properties that have a high likelihood of selling. This reduces outreach by 90% while keeping deal flow steady.
Further fine-tuning by geography can also sharpen your targeting. Hyper-local models – those that assess turnover on a street-by-street basis rather than broader zip codes – can better identify motivated sellers. Adding non-traditional behavioral indicators, like utility shutoffs or increased building permit activity, can uncover potential sellers before they officially list their properties.
This level of precision sets the stage for enriching contact data and refining outreach strategies.
Enriching Contact Information
Even the most accurate property scores are useless if you can’t reach the owner. That’s where skip tracing comes in. This process gathers phone numbers, email addresses, and social media profiles tied to a property owner, while also verifying which contact points are reliable and which are not.
Platforms like BatchData simplify this step by offering tools specifically designed for real estate workflows. Instead of manually combing through public records, you can turn your scored property list into a contact-ready list in one step. Their phone number verification feature ensures your outreach efforts are directed toward active and accurate contact points.
"A single bad data point can invalidate an entire analysis." – BatchData
Maintaining clean, accurate data is essential before reaching out to any property owners.
Testing and Refining Outreach Strategies
No outreach strategy is perfect right out of the gate. That’s why it’s crucial to track metrics like contact rates, response rates, and conversions to refine your scoring model and messaging.
For instance, if a specific segment consistently shows low contact rates, the problem might be with the data quality rather than seller motivation. On the other hand, if contact rates are high but conversions are low, the issue could be with your offer or timing. Use each campaign as a learning opportunity to adjust predictive features and outreach techniques.
Backtesting your scoring model against historical data is another invaluable step. This process helps you confirm whether the model would have accurately identified past sellers. If it can’t reliably predict past outcomes, it’s unlikely to perform well in the future. Regular backtesting ensures your workflow is based on evidence, not assumptions.
Scaling and Maintaining a Data-Driven Acquisition Strategy
Once you’ve streamlined your sourcing workflow, the next step is scaling your strategy. This requires keeping your data fresh, adhering to strict compliance standards, and leveraging professional support.
Refreshing Data and Recalibrating Models
Predictive models rely on accurate, up-to-date data. When market conditions change, models trained on older data can become misaligned, a phenomenon known as overfitting. Overfitted models cling to outdated trends and fail to capture current market signals. To prevent this, recalibrate your propensity-to-sell scores at least quarterly, using the latest transaction records and ownership updates to maintain accuracy.
Data accuracy is an ongoing process. Signals like pre-foreclosure filings or tax liens can change quickly, making data from just two months ago potentially outdated. Shifting to live data feeds and automated webhooks allows you to act on market triggers as they happen, rather than relying on static, periodic updates. As BatchData explains:
"With a continuous data feed, you shift from reacting to market events to anticipating them."
While keeping your data current is essential, compliance with regulatory standards is just as important.
Staying Compliant When Using Enriched Data
As your outreach volume grows, so does the risk of compliance violations. In the U.S., two key regulations govern investor outreach: the Telephone Consumer Protection Act (TCPA) and the National Do Not Call (DNC) Registry. Violations of the TCPA, such as using autodialers without explicit consent, can result in fines of up to $1,500 per violation, while DNC violations can cost more than $50,000 per call. At scale, non-compliance can lead to significant financial penalties.
Before launching any calling or SMS campaigns, scrub your contact lists against the DNC Registry and use skip tracing services to ensure you have the most accurate owner information and limit outreach to the hours of 8 a.m. to 9 p.m. local time. Additionally, every SMS must include an opt-out option, such as "Reply STOP." For signals like active tax liens, verify their current status directly with county offices. While data platforms are excellent for discovery, confirming details at the source ensures accuracy and reduces risk during closing.
Using Professional Data Services to Scale
Building an in-house data science team can be prohibitively expensive, with individual salaries ranging from $130,000 to $190,000 and total team costs exceeding $500,000 annually. For many investors, professional data services provide a more cost-effective way to scale operations.
BatchData offers solutions tailored to high-volume acquisition workflows, with delivery methods designed to meet various needs:
| Delivery Method | Best For | Key Advantage |
|---|---|---|
| Low-Latency APIs | Real-time lookups, CRM enrichment | Fast and precise for targeted queries |
| Bulk Data Delivery | ML model training, large-scale analytics | High data volume and control |
| Cloud Data Sharing | Zero-ETL workflows via Snowflake | Eliminates the need for data pipelines |
For example, BatchData’s Property Intelligence API can instantly append 500+ data points to incoming leads, while its BatchRank propensity scoring model helps investors identify top prospects from a database of over 155 million property records. For those with unique needs, BatchData also offers custom datasets and tailored data pipelines, eliminating the overhead of building these capabilities in-house.
"The relevant metric is not cost, but ROI. Investing in high-quality, complete data pays for itself through superior deal execution and loss avoidance."
Conclusion: Putting Historical Data to Work in Your Off-Market Strategy
Off-market deals don’t have to feel like a guessing game. By tapping into historical signals – like long ownership, absentee status, high equity, and distress indicators – you can pinpoint potential sellers more effectively. When paired with neighborhood trends, these data points help paint a clearer picture of where motivated sellers might be.
The key to consistent success lies in building a repeatable, data-driven system. This involves pulling structured data and creating a straightforward scoring model. For instance, you might assign points for properties with over 15 years of ownership, no recent refinancing, or absentee ownership. Instead of casting a wide net with generic lists, focus your outreach on the highest-ranked properties. Industry benchmarks show that targeted, data-rich lists can lead to 2–3 times higher response rates. This not only improves your cost per deal but also makes your pipeline more predictable. Leveraging dependable data platforms can make this process even smoother.
BatchData offers tools that simplify this strategy. With bulk property datasets, skip tracing, and real-time APIs, BatchData provides the resources you need to power your sourcing efforts. Their platform delivers professional-grade data solutions without requiring an in-house team.
"The question has shifted from, ‘Is this a good deal?’ to ‘What does the data say about this deal’s risk, potential, and portfolio fit?’" – BatchData
As highlighted earlier, having a focused buy box and a systematic scoring model is crucial. Success in off-market investing depends on treating historical data as a continuous process. This means regularly updating records, fine-tuning scores, and adjusting outreach strategies based on actual results. Define your buy box, score your leads, and adapt as you learn – this disciplined approach can set you apart in the competitive off-market space.
FAQs
Which historical data signals matter most for finding off-market sellers?
Key indicators from historical data that can help identify off-market sellers include ownership history, mortgage and transaction records, pre-foreclosure status, and ownership duration. These signals are particularly useful for spotting motivated or distressed sellers, offering valuable insights for uncovering off-market opportunities.
How do I build a simple off-market scoring model without machine learning?
To build a simple off-market scoring model, start by gathering key details about properties and their owners. Look at factors such as ownership history, property characteristics, mortgage status, and pre-foreclosure signs. Assign a score to each of these criteria based on their relevance, then combine them into a single total score. This score helps you identify and prioritize properties that are most likely to be off-market opportunities. The best part? You can achieve this without diving into complex machine learning techniques.
How often should I refresh my data and recalibrate my propensity scores?
To keep your data accurate and relevant to market shifts, it’s important to update and recalibrate propensity scores on a regular basis – every 3 to 6 months is ideal. This schedule ensures you’re making the most of historical data while staying aligned with current industry practices.