



A high propensity score can identify the people most likely to convert, while still directing budget toward customers who would have converted without marketing. That is the central failure in propensity modeling marketing: prediction gets mistaken for causation.
A propensity model estimates the probability that a known person will take a defined future action. The score can support lead routing, audience suppression, lifecycle campaigns, real estate investor outreach, and next-best-action systems. But production teams should pair it with calibration, holdout testing, uplift measurement, identity resolution, and governance.
- Prediction is not incrementality. A score ranks likely behavior, but it doesn't prove that outreach changed the outcome.
- Model choice follows data maturity. Logistic regression may be more useful than deep learning when events are limited or explanations matter.
- Real estate adds hard data problems. Parcel ownership, verified contacts, timing signals, and thin histories rarely arrive in one clean customer record.
- Operational routing matters as much as model quality. Scores only create value when they change who gets contacted, through which channel, and when.
- Cold-start audiences need separate treatment. Models trained on existing records can't automatically discover new customers or repair population bias.
What Is Propensity Modeling and Why It Matters in 2026
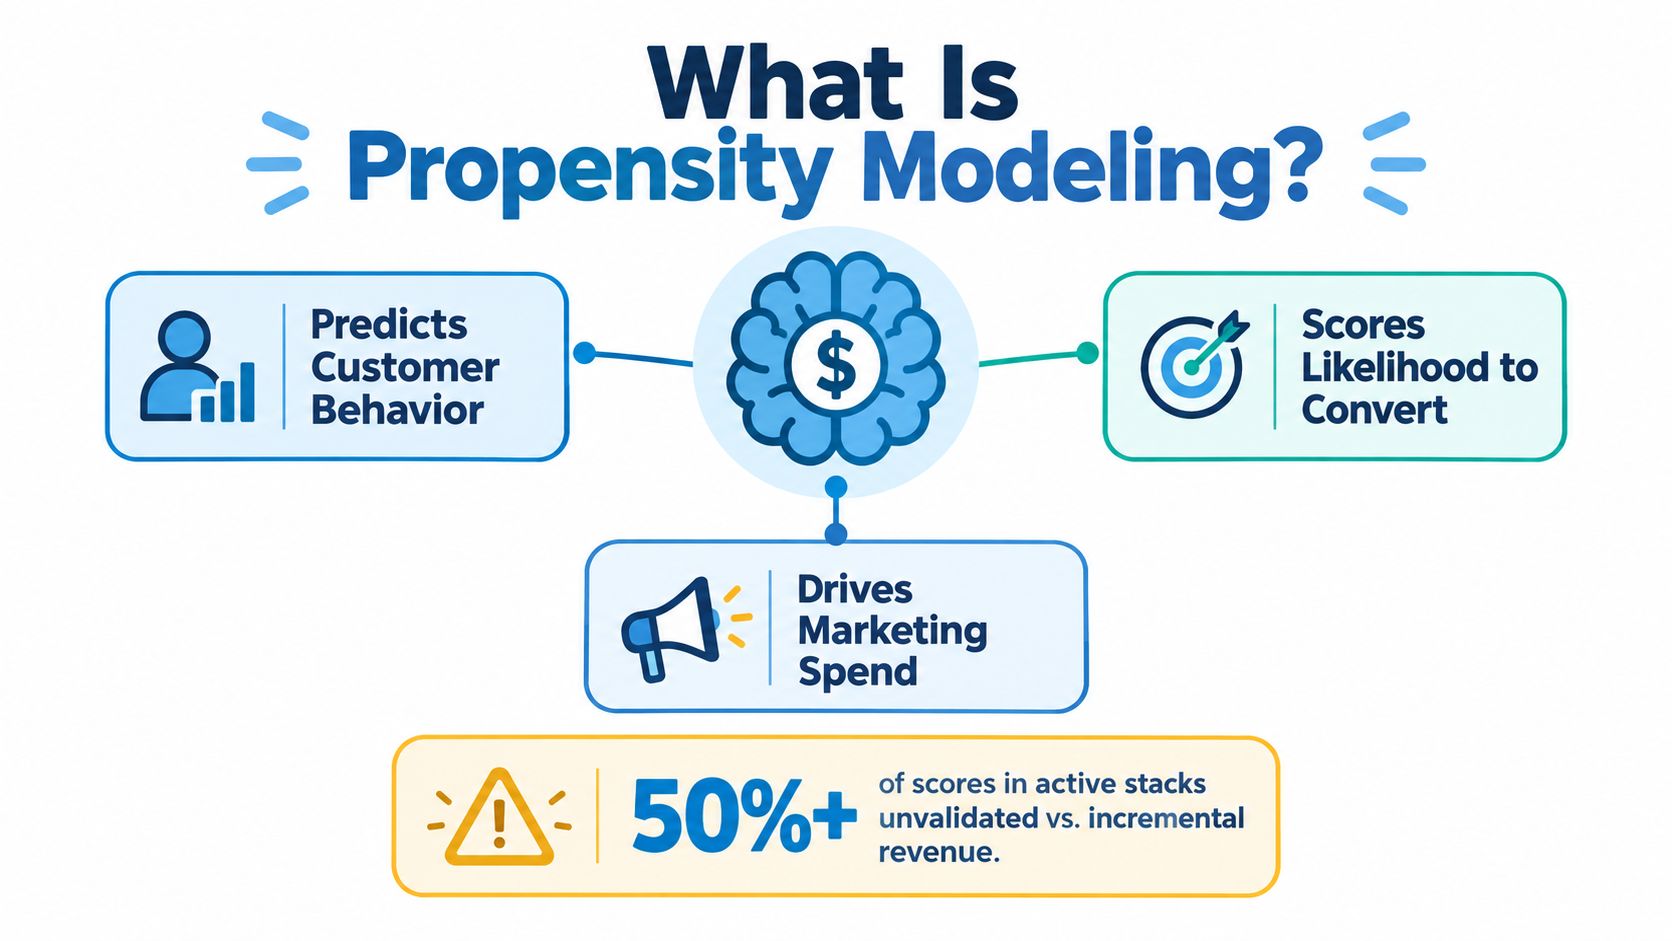
More than half of propensity scores in active marketing stacks may never have been validated against incremental revenue. That claim belongs in the category of an editorial warning, not verified industry statistics. The evidence-backed issue is narrower and more important: propensity modeling is often treated as a standalone answer even though it generally predicts the next action within a fixed choice set, not whether a marketing action caused that action. BCG's analysis of next-best-action gaps explains why a high-propensity customer may have purchased anyway.
A propensity model uses historical customer data, statistical algorithms, and machine learning to estimate the probability that an individual will take a defined future action, such as purchasing, converting, churning, or engaging with a campaign. The output is typically normalized from 0 to 1, or 0% to 100%. A score of 0.85 means an estimated 85% likelihood of the target behavior, not an 85% guarantee, as documented in this propensity modeling definition.
In real estate, the target could be a form submission, an open-house registration, a listing decision, a paid-channel conversion, or a homeowner response to a renovation offer. The model conditions that estimate on observed CRM, property, ownership, transactional, and behavioral features.
Prediction needs a counterfactual
A score answers, “Who is likely to act?” It doesn't answer, “Who is likely to act because we contacted them?” Confusing those questions can push teams toward unnecessary discounts, excessive outreach, and inefficient agent or SDR capacity.
The practical questions are straightforward:
- Which model fits the available data?
- How should the score route leads and audiences?
- Which metrics show whether it works?
- Where does propensity fail?
- What does real estate data add?
- What governance is required before spend is automated?
A useful primer on the mechanics is this overview of propensity modeling, but implementation requires more skepticism than definition pages usually provide. In 2026, next-best-action systems make that distinction urgent because marketers increasingly need coordinated decisions across channels, sequences, and timing, not merely a ranked list.
The Main Model Types Used in Marketing
The right propensity model is determined by event volume, feature structure, explanation requirements, and operational tolerance, not by whichever algorithm a vendor places on a product page. Four model families appear frequently in marketing systems, each with a different production profile.
| Model Family | Interpretability | Min. Data Volume | Cold-Start Behavior | Drift Resistance | Ops Complexity |
|---|---|---|---|---|---|
| Logistic regression | High | Lower event volume can be workable | Weak when new records lack history | Relatively stable when relationships remain simple | Low |
| Gradient-boosted trees | Medium | Suited to structured tabular data | Weak without informative features | Can degrade as feature relationships change | Medium |
| Collaborative filtering | Low to medium | Requires interaction streams | Weak for new users or items | Depends on interaction freshness | Medium |
| Deep learning | Low unless supplemented with explanation methods | Best suited to high-volume first-party events | Weak without embeddings or history | Sensitive to changing sequences and distributions | High |
Logistic regression remains a sensible default when the team needs transparent coefficients, a manageable feature set, and a defensible explanation for routing. It can work well for defined conversion outcomes where the data volume is limited and the relationships are not highly nonlinear.
Gradient-boosted trees, including XGBoost and LightGBM, are a stronger fit for mixed CRM and property-record data. They can capture interactions between tenure, ownership history, assessed-value movement, permits, and engagement without forcing the analyst to specify every interaction in advance. They still need careful feature engineering, validation, and drift monitoring. Feature engineering guidance matters more than the model name.
Match complexity to the signal
Collaborative filtering is useful when the strongest signals are implicit interactions, such as listing views, saved searches, or repeated content engagement. It struggles when a person or property has no interaction history.
Deep learning becomes more defensible when first-party event data is abundant and sequence matters. It also introduces greater operational complexity, more demanding monitoring, and harder explanations. The rule is simple:
- Use logistic regression for transparent baseline scoring.
- Use boosted trees for rich tabular customer and property data.
- Use collaborative filtering for interaction-driven recommendations.
- Use deep learning only when event scale and sequence depth justify it.
A simpler model with reliable labels and disciplined measurement beats a better model deployed on fragmented records.
How Marketers Actually Use Propensity Scores
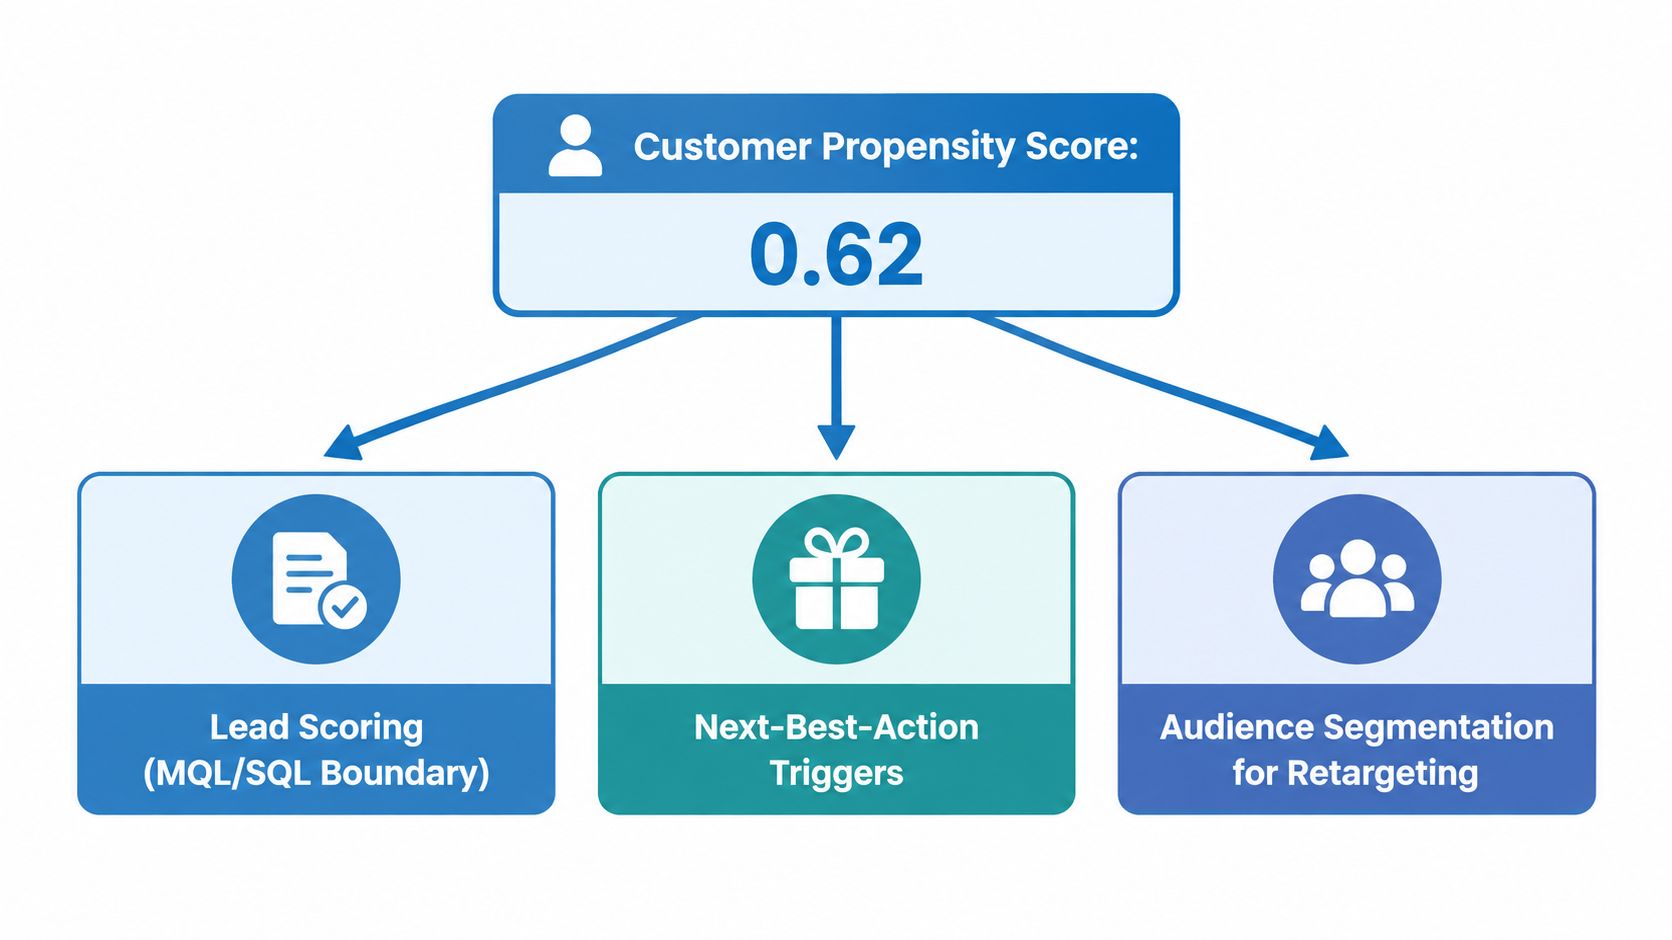
A propensity score becomes useful only when it changes an operational decision. The same numeric output can support lead scoring, segmentation, or campaign targeting, but each pattern needs its own threshold, suppression rule, and business owner.
Lead scoring at the routing boundary
A lead-scoring workflow ranks records by conversion probability and routes them differently. A published example describes assigning a probability between 0 and 1 for a defined action and gives a 0.34 score for a purchase within 30 days, meaning a 34% estimated chance of buying in that period. Faraday's explanation of marketing propensity models illustrates the distinction between a score and a guaranteed outcome.
A real estate team might use a listing-likelihood score to decide whether a record enters an SDR queue, an agent-priority queue, or a nurture path. The threshold should be selected from capacity, economics, and validation, not copied from another company.
Segmentation changes exposure
Segmentation groups audiences by score bands, deciles, or quartiles. High-scoring records may receive direct sales attention, while low-scoring records may be suppressed from an expensive channel or placed into lower-cost nurture. The purpose is not to label people permanently. It's to allocate scarce contact opportunities where the expected value justifies the cost.
Targeting needs cost and recency
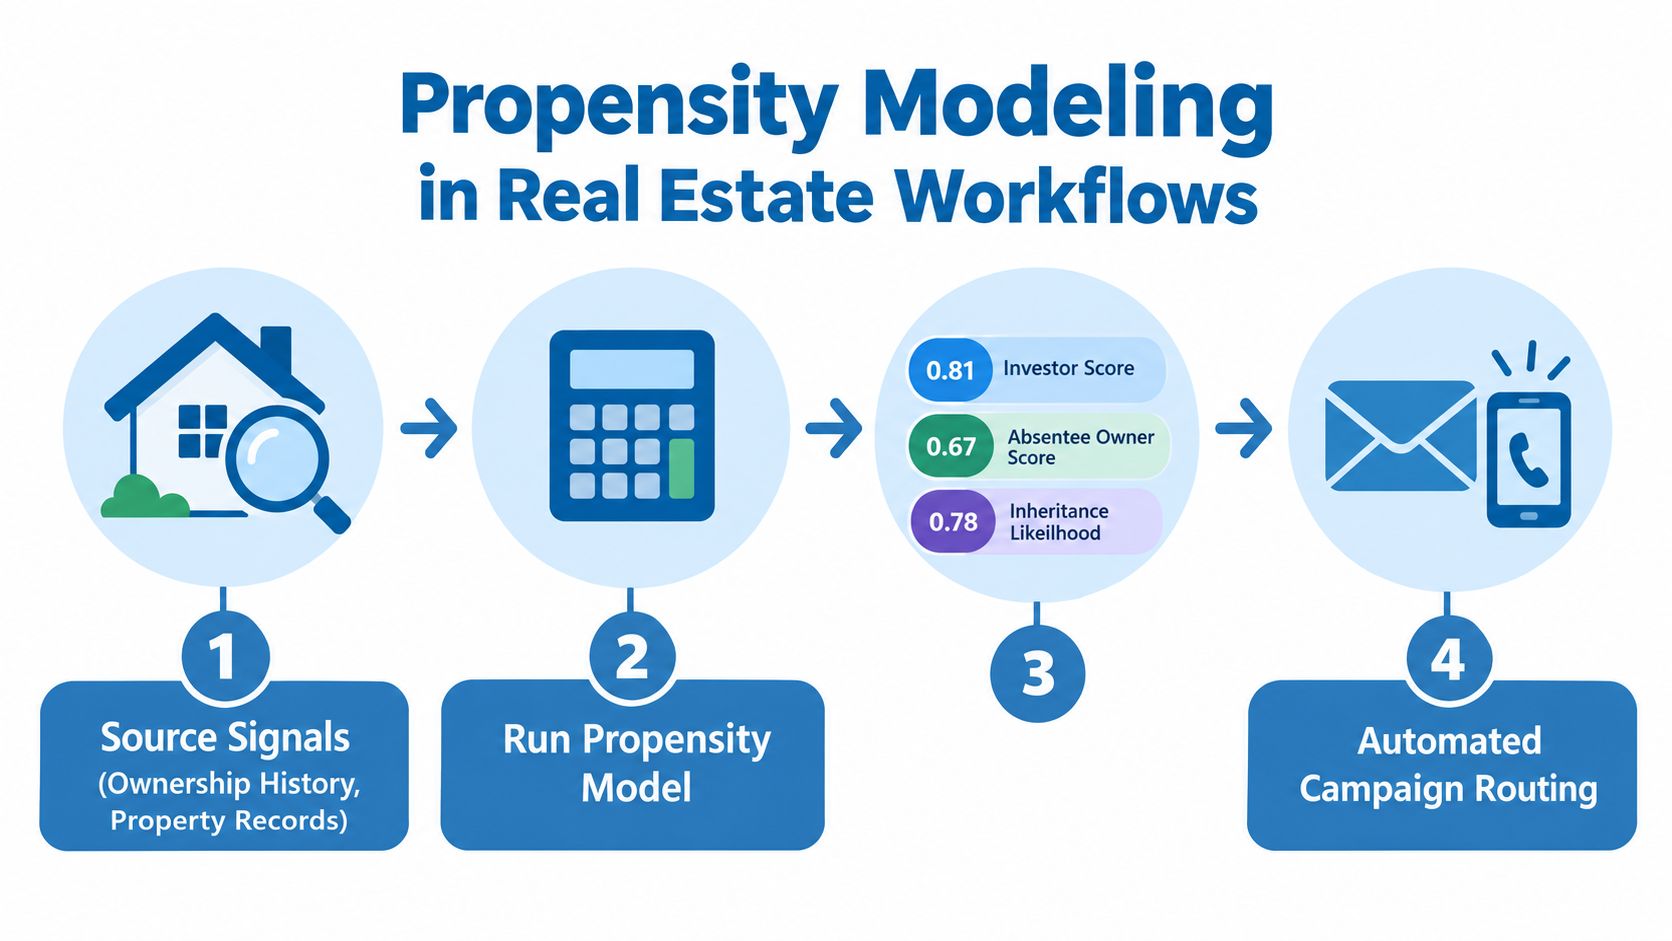
Campaign targeting should combine propensity with recency, contactability, channel cost, and prior exposure. Consider an absentee owner in a target ZIP with a score of 0.67 for a defined outreach outcome. The team might route the record to direct mail when the score clears the mail threshold, reserve a cold call for a higher score or a fresh trigger, and suppress the owner after a prior contact within the campaign's frequency window.
That example demonstrates the design principle without pretending the thresholds are universal. A score is not a campaign strategy. The strategy is the decision layer built around it.
Metrics That Tell You If the Model Is Working
A propensity model needs more than one performance metric because ranking, threshold accuracy, and probability accuracy are different properties. AUC-ROC may show that one model ranks converters above non-converters more effectively, while calibration determines whether the stated probabilities resemble observed outcomes.
| Metric | What It Measures | Best Used For | Common Failure |
|---|---|---|---|
| AUC-ROC | Discrimination across ranking thresholds | Comparing ranking ability | Can look strong while probabilities remain unreliable |
| Lift | Concentration of outcomes in selected score groups | Prioritizing top audience segments | Can hide weak performance outside the selected group |
| Precision and recall | Hit rate and coverage at a chosen threshold | Threshold-gated routing | Improving one can reduce the other |
| Calibration curve | Whether predicted probabilities track observed rates | Budgeting and decision confidence | A well-ranked model may still overstate likelihood |
AUC is useful when the campaign can act on a ranked audience and the exact probability matters less than ordering. Lift is more directly tied to audience selection because it asks whether the top-scored group contains more target outcomes than a broader baseline.
Precision matters when every routed lead consumes scarce sales capacity. Recall matters when missing a qualified opportunity is more costly than contacting additional records. Neither metric is meaningful without a defined threshold and a clear operational consequence.
Why calibration changes the decision
Suppose one model has an AUC of 0.72 and another has an AUC of 0.68. Those figures alone do not establish which model should receive the budget. If the first model's probabilities are poorly calibrated, it can overstate expected response and cause the team to over-contact or overpay for an audience. The second model may rank somewhat less effectively but provide probabilities that track observed conversion rates more closely, producing safer threshold and budget decisions.
Practical rule: Choose the primary metric from the campaign's decision type, not from a dashboard habit.
Use AUC and lift for rank-and-target programs. Use precision and recall for threshold-gated workflows. Use calibration when scores determine spend, capacity, offer intensity, or contact frequency. Then validate the chosen policy with a holdout, because offline metrics cannot prove that the campaign caused the outcome.
The Incrementality Gap and Why Uplift Matters
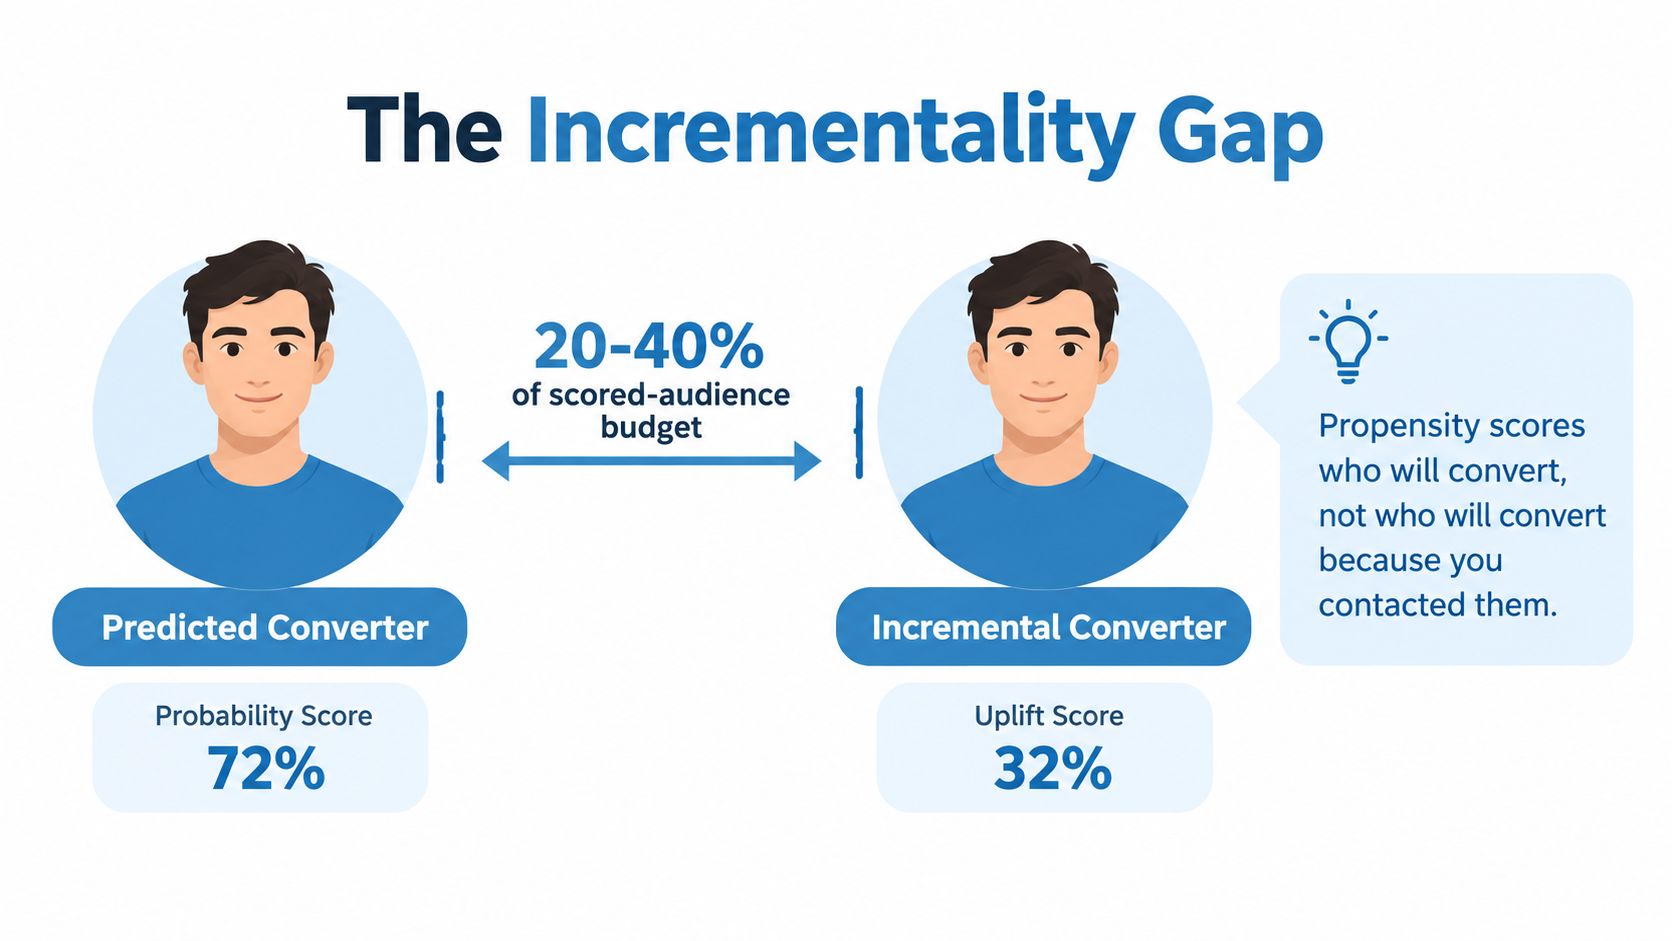
A propensity score estimates who will convert. An uplift model estimates how much the outcome changes under treatment compared with control. BCG's 2026 analysis identifies this distinction as a major gap in next-best-action programs, because a customer with high purchase propensity may have purchased without the offer. The documented uplift workflow formalizes the comparison by scoring the same validation record under treatment and control, then calculating uplift as ∆P = P(test) – P(control).
The practical consequence is severe, but the specific claim that propensity costs teams 20% to 40% of scored-audience budget is not supported by the verified data provided here. The defensible conclusion is qualitative: propensity-only targeting can allocate spend to sure things rather than persuadable customers.
Four treatment-outcome groups
Uplift analysis commonly separates people into four conceptual groups:
- Persuadables: More likely to act when contacted.
- Sure things: Likely to act with or without contact.
- Lost causes: Unlikely to act under either condition.
- Sleeping dogs: Contact may reduce the likelihood of the desired action.
A raw propensity score often favors sure things because they have a high baseline response probability. Uplift targeting instead looks for the treatment effect, which can redirect budget toward people whose behavior is changeable.
A testable production workflow
Start with a randomized treatment and control design. Keep the treatment cost visible, preserve the holdout, and report uplift at the selected audience depth, rather than only reporting overall conversion.
A practical sequence is:
- Define the action and treatment clearly.
- Randomly assign eligible records to treatment and control.
- Train or estimate treatment and control response behavior.
- Score records under both conditions.
- Calculate the response difference.
- Compare incremental outcomes after treatment costs.
Teams that need a practical testing framework can use how to design incrementality tests as a reference. Individual-level uplift modeling requires stronger experimentation discipline and sufficient outcome signal. Where that isn't available, a calibrated propensity model paired with a properly designed holdout is often the safer starting point.
Real Estate Use Cases for Propensity Modeling
Real estate propensity modeling works best when the target action is explicit and the score connects to a concrete routing decision. Property records provide context, but they don't automatically solve identity, timing, or contactability.
Investor acquisition
An investor campaign can score properties or owners using ownership history, transfer frequency, equity tenure, assessed-value movement, lien information, and listing behavior. The label might be a sale, a response, an accepted offer, or another defined event within a chosen observation window. The routing decision could determine which records enter direct mail, outbound calling, broker review, or a monitoring list.
The model shouldn't treat every owner with the same history as equally actionable. A long-tenured owner with changing property conditions may need a different message from a recent purchaser, even if both receive similar sale-likelihood scores.
Home services and agent recruitment
Absentee-owner and inheritance-likelihood signals can support home-services outreach when combined with relevant property conditions and verified contact information. Permit history may help identify renovation-related opportunities, while homeowner propensity can support geo-targeted campaigns for renovation or solar advertisers.
Brokerages can use listing-likelihood prediction to prioritize recruiting outreach to owners or agents associated with likely future listings. The label must describe the behavior the campaign can influence, not merely a broad market event.
Timing and identity remain the constraints
Newly built properties and records with thin behavioral history create a cold-start problem. A propensity model works on people already in the database, cannot discover new customers by itself, and inherits the biases and size limits of that existing population, as explained in this discussion of targeting limitations.
Parcel identity also differs from person identity. Account-level or property-level propensity doesn't tell a marketer which contact is reachable or authorized for personalized outreach. Teams may need separate identity resolution and deanonymization tools, especially when visitor behavior must connect to a verified owner record.
The highest-value real estate score is often not the highest score. It's the score attached to the right person, at the right property, immediately after a meaningful trigger.
Refinance activity, probate filings, and other life-event signals can improve timing, but they still need consent review, freshness checks, and a treatment design that tests whether the outreach changes behavior.
Data Requirements, Bias, and Governance
A usable marketing propensity model needs four data foundations: behavioral events, transactional history, declared attributes, and identity-resolution keys. Without behavioral or transaction labels, the model has no reliable outcome to learn. Without identity keys, the score can't reach the person or property that the campaign intends to contact.
Build the training set around the decision
Define the target action, observation window, eligibility rules, and exclusion rules before selecting features. A model for listing likelihood needs a label tied to listing behavior. A model for lead conversion needs a conversion definition. Mixing outcomes because they're convenient creates a score that sounds predictive but routes no specific decision reliably.
Watch for label leakage. A feature captured after the target action, or a field created by a sales process that already knew the outcome, can make offline performance look strong while offering no usable pre-action signal.
Treat population bias as a modeling problem
Training data drawn mostly from existing customers can suppress scores for net-new or lightly observed audiences. The result isn't just lower coverage. It can embed the company's acquisition history into the model and make the model reproduce who the business already reaches.
Suppressed, deleted, or consent-restricted records can also distort the training distribution. Governance therefore belongs in model design, not as a final legal review.
Before launch, check:
- Freshness: Confirm event timestamps, property updates, ownership changes, and contact records are current enough for the decision.
- Leakage: Remove features unavailable at scoring time or created after the label event.
- Representativeness: Compare training populations with the audience that will receive the campaign.
- Fairness: Review score distributions and routing outcomes across relevant demographic or protected groups.
- Consent: Apply GDPR, CCPA, TCPA, and applicable platform rules to collection, enrichment, targeting, and contact.
- Holdout documentation: Record assignment logic, treatment exposure, exclusions, primary metric, and review cadence.
- Monitoring: Define what triggers retraining when behavior, inventory, channels, or data coverage changes.
The data governance practices guide is useful for formalizing ownership, documentation, and access controls. No vendor score removes the obligation to explain why a record was selected and how the team will detect harm or degradation.
Frequently Asked Questions About Propensity Modeling
| Question | Short Answer |
|---|---|
| How does propensity differ from intent data? | Propensity estimates likely future behavior from historical features. Intent captures recent signals of active interest. Combining them can improve routing when each signal has a defined role. |
| Should scoring run in batch or real time? | Batch scoring suits stable lists and scheduled campaigns. Real-time scoring suits event-triggered journeys where latency affects the next action. |
| What are common failure modes? | Label leakage, concept drift, selection bias, weak identity resolution, and untested treatment effects. |
| What should happen during the first 30 days? | Establish a baseline, choose a narrow pilot audience, preserve a holdout, launch controlled routing, and review outcomes on a fixed cadence. |
Propensity versus intent
Propensity is a modeled estimate based on historical patterns. Intent is usually a more immediate behavioral or declared signal, such as a recent search, page interaction, inquiry, or known event. A recent intent signal can be valuable even when historical data is thin, while propensity can provide useful prioritization when current activity is quiet.
The combination needs a policy. For example, intent can raise urgency, while propensity can influence channel choice or sales capacity. Combining both blindly only creates a more complicated score with no clearer decision.
Batch versus real time
Batch scoring is appropriate for investor lists, scheduled direct mail, recurring nurture, and periodic portfolio review. Real-time scoring is more appropriate when a new event should trigger an immediate next action. The tradeoff is operational complexity, latency, data freshness, and the cost of maintaining event pipelines.
The first 30 days
Start with a baseline using the current routing policy. Select one audience and one outcome, define treatment and control before activation, and document the score threshold or ranking rule. Review conversions, contact costs, suppression behavior, calibration, and data exceptions on a fixed cadence. Don't expand to multiple channels until the first policy has a credible measurement record.
Concept drift appears when the relationship between features and outcomes changes. Selection bias appears when the training population differs from the scored population. Label leakage appears when the model learns information that wasn't available at decision time. These are production failures, not theoretical footnotes.
BatchData provides property records, ownership history, valuations, and verified owner contacts that can support real estate propensity workflows, including its BatchRank sale-propensity scoring capability. If you're connecting property signals to identity resolution and campaign routing, visit BatchData to evaluate the available data and delivery options.