



SEO Title: Liquidity in Real Estate Measurement and Strategy
Meta Description: Learn how to measure liquidity in real estate with TOM, price dispersion, market depth, and data platforms.
Meta Keywords: liquidity in real estate, real estate liquidity, time on market, price dispersion, RCA liquidity score, real estate data platforms, tokenized real estate, portfolio liquidity
Most investors misprice liquidity in real estate because they reduce it to one lazy question: How fast can I sell? That shortcut hides the true risk. A property can sell quickly because buyers are plentiful, or because the seller accepted a painful discount.
The practical fix is to treat liquidity as a measurable market variable, not a vibe. If you track the right signals, you can estimate exit friction, compare assets across markets, and spot where liquidity is real versus where it's being manufactured by price cuts.
Core takeaways
- Liquidity is multi-dimensional: Institutional analysis breaks it into tightness, depth, breadth, resilience, and immediacy.
- Single metrics mislead: Time on market matters, but it becomes much more useful when paired with price dispersion.
- Market context matters: Institutional investors often assess liquidity at the market level, not just the property level.
- Modern data changes execution: Listings, transaction history, ownership, debt, and market activity can be assembled into a working liquidity model.
- Illiquidity can be useful: If you can measure it better than competitors, you can price risk better than competitors.
Introduction
Liquidity in real estate is usually misunderstood precisely where it matters most: at exit. Buyers and operators spend enormous time on acquisition models, then treat saleability as a rough assumption. That's a mistake because liquidity isn't just “easy to sell.” It's the combination of speed, price certainty, buyer depth, execution cost, and market recovery after stress.
Institutional research has framed this much more clearly. Real-estate liquidity is commonly decomposed into tightness, depth, breadth, resilience, and immediacy, which is a far more useful lens than the retail shorthand of “fast sale.” If you're building underwriting models, pricing bridge loans, ranking lead opportunities, or designing proptech products, that difference changes what data you collect and how you interpret it.
A practical liquidity framework should answer four questions:
- How fast can it trade
- At what discount or premium
- With how many credible counterparties
- How stable is pricing if the market gets stressed
That's the difference between surface activity and usable liquidity. The rest of the analysis is about turning those questions into measurable signals.
What Is Real Estate Liquidity Really
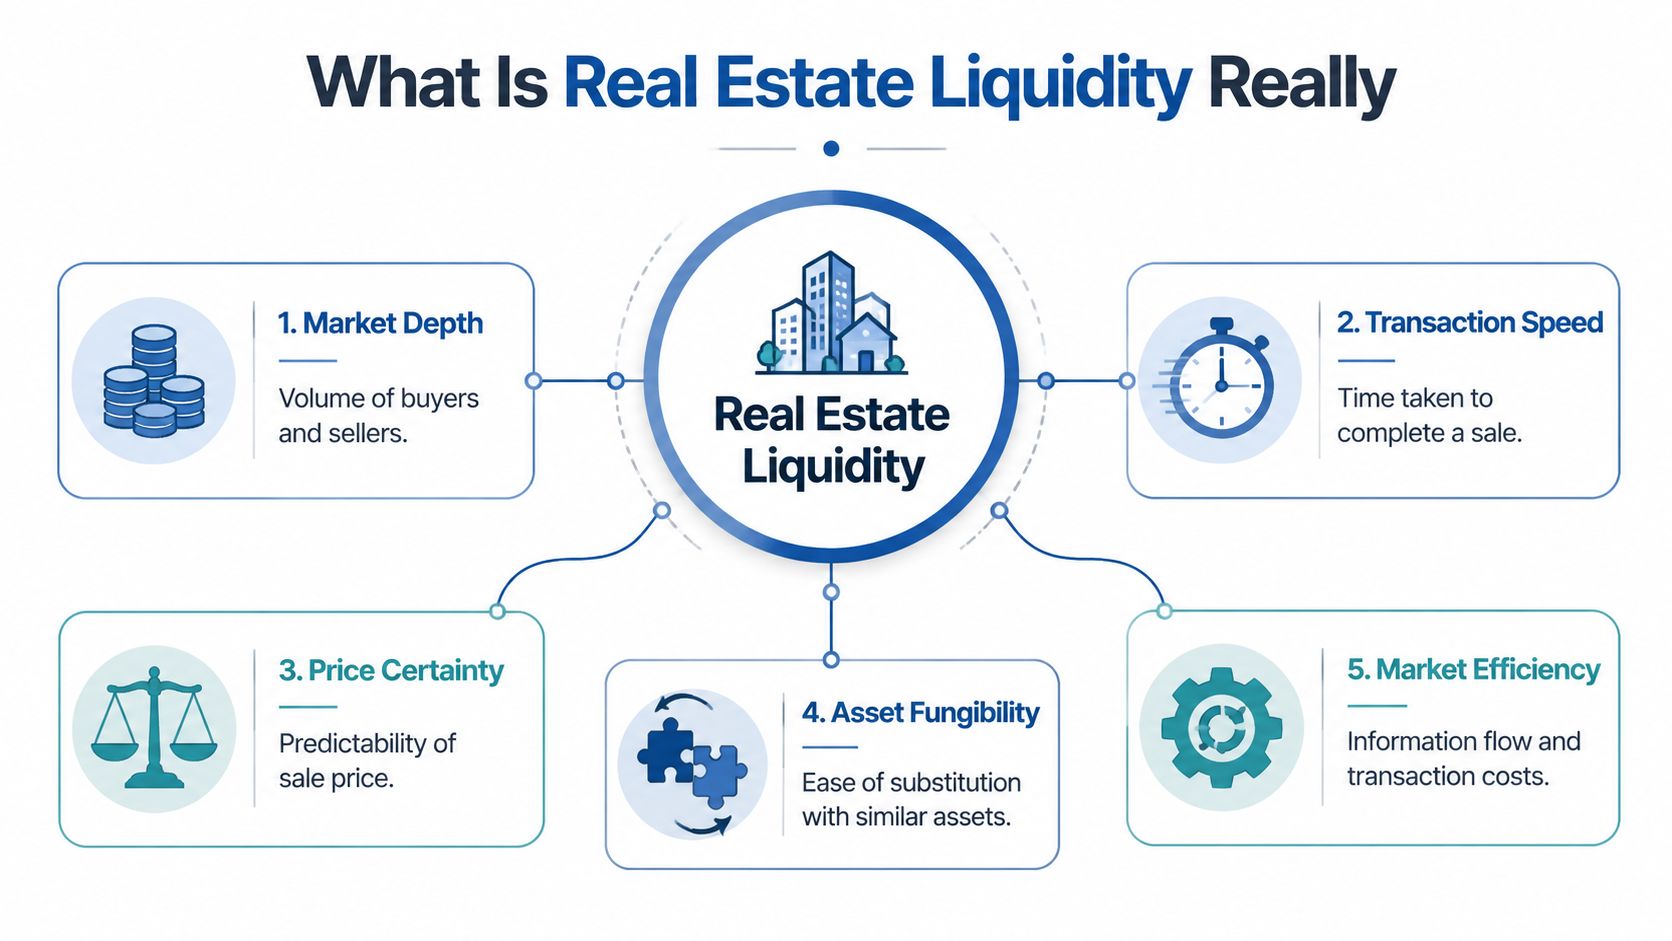
Real estate liquidity is the ability to convert an asset into cash within a reasonable time and at an acceptable price concession. The speed part matters, but the pricing part matters just as much.
Institutional analysts usually break liquidity into five dimensions. That framework is more useful than any one-number shortcut because each dimension captures a different kind of exit risk. In direct commercial property markets, the IPF review notes that real-estate liquidity is typically decomposed into tightness, depth, breadth, resilience, and immediacy, and that immediacy is often the most actionable benchmark because it reflects the discount or premium required to transact quickly, while depth reflects how much capital can trade without moving prices, as outlined in the IPF review of liquidity measurement.
The five dimensions that matter
| Dimension | Plain-English meaning | What investors should ask | Why it matters |
|---|---|---|---|
| Tightness | How expensive it is to trade | What price concession is needed to close? | High friction destroys realized value |
| Depth | How much capital can transact | Can this asset size clear without moving price? | Large positions need real buyer capacity |
| Breadth | How many active buyers and sellers exist | Is there one buyer or a market of buyers? | More counterparties usually means better exit options |
| Resilience | How fast pricing recovers after disruption | Does the market bounce back after a forced trade? | Fragile markets stay illiquid longer |
| Immediacy | The cost of speed | What does a fast execution cost me? | Urgency usually has a price |
Why fast sales can fool you
A short marketing period sounds positive, but it isn't always. A seller can reduce time to close by cutting price hard enough. That does not mean the market is liquid in the healthy sense.
Practical rule: If a market clears quickly only when sellers keep conceding price, you're looking at urgency, not strength.
Often, investors get tripped up. They celebrate velocity and ignore the path used to create it. For a practitioner, that means liquidity isn't one trait of the property. It's a profile shaped by market participation, information quality, financing conditions, and the price required for execution.
Why this matters for data products
If you're building software around acquisition, disposition, servicing, or underwriting, a binary label like “liquid” is too crude. Better systems estimate a property's tradability through a mix of market-level and asset-level signals.
That's also why strong liquidity analysis needs more than listings alone. Listings show intent. Closed transactions show clearing behavior. Debt, owner equity, and buyer participation help explain why a market is moving the way it is.
How Do You Quantitatively Measure Real Estate Liquidity
You measure liquidity in real estate by combining time-based, price-based, and market-capacity indicators. The most useful starting point is time on market paired with price dispersion, then expanded with turnover, bid-ask behavior, and market depth.
A foundational empirical result is worth keeping in mind. In a large residential market study, a 1% increase in home equity ratio was associated with approximately a 1% increase in price dispersion, a 0.9-month decrease in time on market, and a 9.85% decrease in transaction prices, according to the study on time on market and price dispersion. The important takeaway isn't just the coefficients. It's the interpretation: lower time on market by itself can be misleading because faster sales may reflect stronger demand or greater seller willingness to accept lower prices.
The core liquidity scorecard
| Metric | Definition | Data Required | What It Signals |
|---|---|---|---|
| Time on market | Time between listing and sale | Listing dates, contract dates, close dates | Execution speed |
| Price dispersion | Variation in sale prices across similar assets | Comparable sales, property attributes, sale prices | Price certainty or pricing noise |
| Bid-ask spread proxy | Gap between asking levels and closed prices | Listing prices, price changes, final sale prices | Tightness and negotiation friction |
| Turnover | How frequently similar assets trade | Transaction history by asset type and submarket | Market activity and exit frequency |
| Depth | Capacity for capital to transact without moving price | Buyer universe, deal count, deal size, repeat activity | Whether size can clear cleanly |
Why TOM without PD is weak
Time on market is easy to understand and easy to misuse. If a submarket shows faster closes, you still don't know whether buyers are competing aggressively or sellers are discounting aggressively.
That's why price dispersion matters. When similar properties close at widely varying prices, the market is telling you that price discovery is noisy. In practical terms, noisier price discovery means weaker confidence in your exit estimate.
A fast market with unstable pricing can be less liquid than a slightly slower market with narrow pricing outcomes.
What to calculate at the market level
If you're comparing geographies or product types, start with a market scorecard rather than a single-asset conclusion.
Use these inputs:
- Closed-sale cadence: Count how often similar assets trade.
- Listing-to-close behavior: Track relists, price cuts, and stale inventory.
- Buyer concentration: Note whether a few repeat acquirers dominate activity.
- Execution discount: Estimate the gap between marketed pricing and cleared pricing.
For valuation-sensitive decisions, you also need disciplined appraisal support. If you're deciding when you need a Red Book valuation, formal valuation work can help separate a real liquidity problem from a pricing expectation problem.
What to calculate at the asset level
The same market can treat two nearby properties very differently. Asset-level liquidity often turns on details that broad market reports flatten.
Focus on:
Property type fit
Standardized assets usually trade more predictably than unusual ones.Lot and building complexity
The more bespoke the asset, the smaller the buyer pool tends to be.Income profile
Stable leases and clean rent rolls usually improve underwritability, which supports liquidity.Capital stack pressure
Owners with high levels of debt or maturity pressure often accept worse terms to create speed.
If you're building this into a product workflow, a trend layer helps. A market analytics workflow like real estate market trends analysis can be useful for spotting where transaction velocity and pricing stability are diverging.
A simple operating rule
Don't ask whether an asset is liquid. Ask:
- Liquid for whom
- At what size
- At what speed
- At what price concession
That framing produces better models and fewer surprises at exit.
What Market and Asset Factors Drive Liquidity
Liquidity changes because markets change and assets differ. Some drivers are external, such as capital availability and market participation. Others are embedded in the property itself, such as complexity, condition, and owner positioning.

At the institutional level, liquidity is often assessed as a market characteristic rather than a property trait. One widely used benchmark cited by INREV is the RCA liquidity score, which combines data from 155 global real estate markets to estimate the depth and breadth of capital active in each market, as described by INREV's discussion of measuring direct real estate market liquidity.
Market-level drivers
A market can look active and still be shallow. That happens when a lot of people are watching, but only a limited set of buyers can close at institutional size.
The main market-level drivers are usually:
- Capital depth: More active capital generally supports cleaner exits.
- Breadth of participants: A market with many buyer types is less fragile than one dominated by a narrow cohort.
- Pricing consensus: When buyers and sellers disagree sharply, liquidity drops even if listing activity remains high.
- Regulatory and financing conditions: Deal friction rises when approvals, documentation, or financing become harder.
Asset-level drivers
A single asset can trade above or below its market's baseline liquidity. That spread usually comes from things buyers can't easily ignore during underwriting.
Common asset-level drivers include:
| Driver | More liquid version | Less liquid version |
|---|---|---|
| Location | Established, well-covered submarket | Thinly traded or harder-to-underwrite area |
| Physical condition | Straightforward capex story | Deferred maintenance or major unknowns |
| Income structure | Readable, durable cash flow | Irregular income or weak documentation |
| Ownership posture | Flexible, realistic seller | Stressed seller with unrealistic expectations |
A practical analysis workflow
An investor screening a small portfolio would usually start broad, then narrow. First, compare submarkets for actual transaction activity and visible supply conditions. Then review each asset's ownership, mortgage position, listing history, and physical profile.
API-based workflows become useful. A developer or analyst can combine ownership, listing, and financing signals into one model instead of checking scattered records manually. A guide to supply and demand modeling with real estate APIs shows the kind of workflow that supports this.
Later in the process, watch how the market narrative changes once real underwriting begins.
Markets lose liquidity first through disagreement, then through inactivity.
That sequence matters. When buyers and sellers stop agreeing on value, transaction counts often weaken after the pricing gap has already widened.
How to Assess Liquidity with Real Estate Data Platforms
A data platform makes liquidity measurable by turning scattered market signals into a repeatable scorecard. That scorecard should combine property characteristics, transaction history, ownership and debt data, and current listing activity.
A working assessment usually starts with a target list. For example, an investor might review a rental portfolio and ask which assets could be sold without unusual discounting if capital needs changed. That's not a valuation question alone. It's a data integration problem.
Build the liquidity file first
The fastest way to get this wrong is to start with a single AVM or a single listing feed. Liquidity modeling needs a broader file.
Pull these categories:
- Property characteristics: Type, size, age, location, use, and physical complexity.
- Transaction history: Prior transfers, hold period clues, repeat turnover patterns.
- Mortgage and lien data: Signals of owner equity, refinancing pressure, or distress risk.
- Listing activity: Current and historical listing status, price changes, relist patterns.
- Ownership data: Portfolio overlap, absentee status, entity ownership, and sale propensity clues.
One option for this kind of workflow is BatchData, which provides property, ownership, listing, valuation, mortgage, and lien data through platform search and API delivery. If you're comparing vendors before building a workflow, this guide on how to choose the best real estate data provider for your business is useful because vendor gaps directly affect liquidity models.
Turn raw records into a decision model
Raw records don't tell you much until you impose structure. A practical model usually asks four binary questions first:
- Can this asset trade in its current condition without special financing?
- Is the likely buyer pool broad or narrow?
- Is the owner structurally motivated or purely opportunistic?
- Does recent listing behavior suggest realistic pricing or a stale ask?
Then add qualitative scoring. You don't need fake precision. A simple traffic-light system often works better than a fragile formula.
| Signal group | Green | Yellow | Red |
|---|---|---|---|
| Market activity | Comparable assets are trading | Activity is uneven | Few credible comps are clearing |
| Seller posture | No obvious pressure | Possible timing pressure | Debt or distress may force action |
| Listing behavior | Clean marketing history | Some repricing | Repeated cuts or relists |
| Asset complexity | Broad buyer fit | Moderate underwriting work | Highly specialized or hard to finance |
What actually improves the assessment
Three practices matter more than fancy dashboards.
- Use trailing changes, not snapshots: Liquidity deteriorates gradually before it becomes obvious.
- Separate market weakness from seller urgency: They aren't the same thing.
- Track exit paths, not just asset values: A value estimate without an execution estimate is incomplete.
Field note: The best liquidity models don't try to predict one sale price. They estimate the range of likely outcomes under different time constraints.
That's also where new transaction rails become relevant. The Bank for International Settlements found that tokenised real estate properties tend to emerge in areas with lower property prices, weaker demand, and less liquidity, implying tokenisation may be functioning first as a niche market-making layer for harder-to-sell assets rather than as a blanket liquidity solution. For practitioners, that's a reminder to treat new distribution channels as targeted tools, not universal fixes.
What Strategies Improve Asset and Portfolio Liquidity
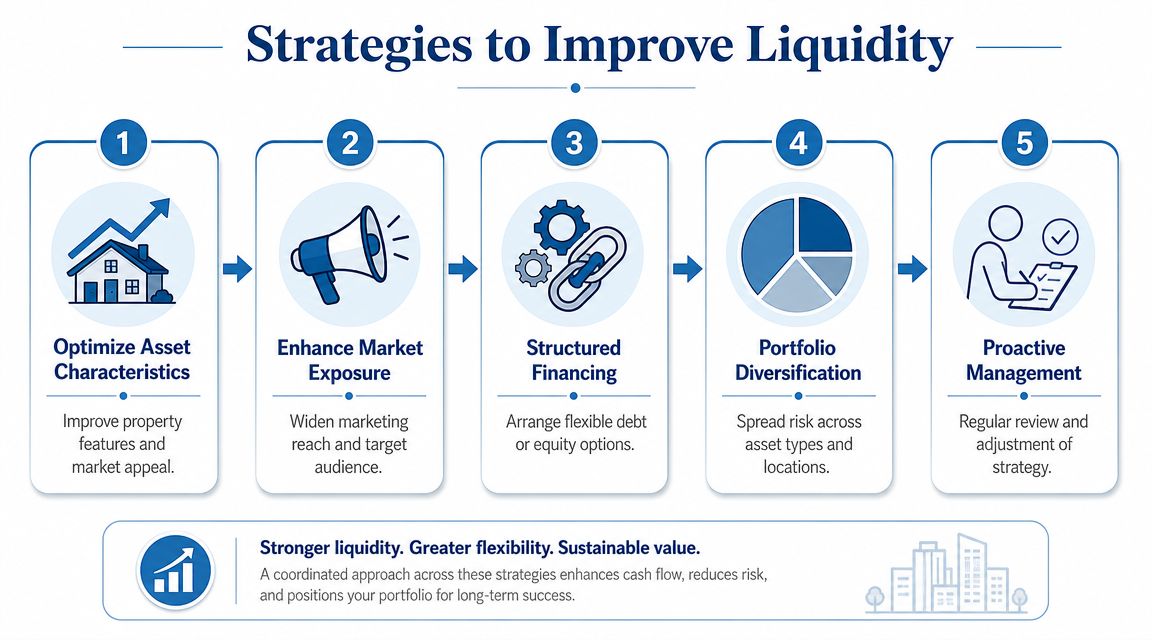
The best liquidity strategy is to reduce exit friction before you need an exit. That means improving buyer fit, sharpening pricing discipline, widening distribution, and structuring deals around the actual buyer pool instead of the hoped-for one.
Start with the obvious friction
Most liquidity problems are operational before they become financial. Buyers hesitate when records are messy, deferred maintenance is unclear, leases are hard to read, or the seller's pricing posture doesn't match the market.
Practical fixes include:
- Improve underwriting readability: Clean rent rolls, complete property records, and documented capex reduce buyer hesitation.
- Price for execution: Static pricing in a changing market often lengthens hold time and increases eventual concessions.
- Broaden financing paths: Seller financing or more flexible structures can expand the buyer pool where conventional debt excludes too many bidders.
Decide whether to sell assets or packages
Portfolio structure changes liquidity. Sometimes a basket of assets attracts larger, better-capitalized buyers. Sometimes it suppresses demand because only a narrow group can absorb the package.
| Strategy | Works best when | Main trade-off |
|---|---|---|
| Sell individually | Assets are uneven and appeal to different buyer types | More process work |
| Sell as a portfolio | Assets are coherent and institutional buyers can underwrite the package | Buyer pool can narrow |
| Hybrid approach | A few assets are strong anchors and weaker ones need context | Execution gets more complex |
Use targeted exposure, not generic marketing
General exposure doesn't solve a thin market. The better move is to identify who can close, then market to that audience with asset-specific information that removes underwriting uncertainty.
That may mean:
- targeting owner-operators instead of institutions
- targeting yield buyers instead of value-add buyers
- emphasizing assumable income characteristics rather than headline listing language
Treat tokenization as a selective tool
Most commentary on tokenization treats it as if it automatically fixes liquidity. The evidence is more nuanced. A Bank for International Settlements study found that tokenised real estate properties tend to emerge in areas with lower property prices, weaker demand, and less liquidity, which suggests the first use case is often market-making for harder-to-sell assets rather than turbocharging already liquid ones, as discussed in the BIS work on tokenised real estate and market structure.
That's the contrarian view worth keeping. If you're evaluating RWA tokenization development, treat it as infrastructure that may help certain ownership structures and thin markets. Don't assume it eliminates the need for pricing discipline, due diligence, or buyer qualification.
Liquidity tools don't replace liquidity fundamentals. They change how buyers access the asset. They don't erase weak demand.
The real advantage
Discerning investors don't try to make every asset liquid. They decide which assets should remain illiquid because the return compensates for it, and which assets need cleaner exit options because the strategy depends on flexibility.
That's where the edge sits. Better data lets you distinguish:
- temporary illiquidity from structural illiquidity
- weak pricing from weak demand
- broad market slowdown from asset-specific stigma
If you can make those distinctions earlier than the market, illiquidity stops being just a hazard. It becomes a source of pricing edge.
Final Thoughts Turning Illiquidity into an Advantage
Illiquidity in real estate isn't just a risk. It's also a filter that creates opportunity for investors who can measure it correctly. Private markets stay inefficient because information is uneven, transaction costs are real, and assets don't trade continuously. That friction scares away shallow analysis. It rewards disciplined analysis.
The practical shift is simple. Stop treating liquidity as a yes-or-no trait. Treat it as a set of measurable conditions tied to speed, price certainty, buyer depth, and execution cost. Once you do that, you can underwrite exits with more realism, compare markets more accurately, and identify where a cheap asset is simply hard to sell.
For proptech teams, this has product implications. Search, valuation, underwriting, lead scoring, and portfolio monitoring all become stronger when liquidity signals are integrated instead of implied. For investors, it changes capital allocation. A supposedly attractive deal can become mediocre once exit friction is priced correctly. A neglected deal can become attractive if the market overstates its liquidity risk.
That's the durable takeaway. In real estate, better liquidity measurement doesn't just reduce mistakes. It helps you see mispricing that other buyers miss.
If you want to operationalize these ideas, BatchData can help you build liquidity-aware workflows using property, ownership, listing, valuation, mortgage, and lien data in one system, whether you're underwriting acquisitions, monitoring a portfolio, or building a proptech product.