


SEO Title: Cuyahoga County Home Sales | 2026 Market Data & Trends
Meta Description: Get the latest 2026 data on Cuyahoga County home sales. Analyze median price, inventory, and investment trends to make data-driven decisions.
Meta Keywords: cuyahoga county home sales, cleveland housing market, real estate investing ohio, cuyahoga county property data, 2026 housing market forecast, real estate market analysis, ohio property investment
The Cuyahoga County home sales market in 2026 is defined by a fundamental imbalance: intense buyer demand is clashing with critically low inventory, creating a high-velocity environment where data-driven precision is non-negotiable.
This guide delivers the core metrics, underlying drivers, and strategic data applications necessary to navigate this competitive landscape. For investors, lenders, or proptech innovators, timely, accurate intelligence is the only path to success.
- Key Finding 1: The market is bifurcated. While 30.3% of homes sell above list price, a majority (55.2%) sell below, creating distinct opportunities for savvy buyers.
- Key Finding 2: The sub-$200k starter home segment is the market's engine, with a median of just 15 days on market and +9.1% YoY price growth.
- Key Finding 3: Historical appreciation shows a resilient market, with a compound annual growth rate of over 8% from 2021-2025, providing a stable foundation for investment.
This analysis unpacks the specific data points that allow you to capitalize on these trends before the competition.
What is the state of the Cuyahoga County home sales market in 2026?
The Cuyahoga County market is a mature, stable market experiencing significant strain from a severe lack of housing supply. This imbalance creates a fast-paced environment where rising prices and rapid sales coexist with opportunities for deals below asking price, demanding a granular, property-level approach for any market participant.

Cuyahoga County Market at a Glance (Q1 2026)
| Metric | Value | Year-Over-Year Change |
|---|---|---|
| Median Sale Price | $187,483 | ▲ 4.8% |
| Average Home Value | $210,764 | ▲ 4.8% |
| Median Days to Pending | 19 days | ▼ -5.0% |
| Homes For Sale (Inventory) | 2,874 | ▼ -8.2% |
| Sale-to-List Price Ratio | 0.989 | ▲ 0.2% |
| Homes Sold Over List Price | 30.3% | ▲ 1.7% |
| Homes Sold Under List Price | 55.2% | ▼ -2.3% |
These metrics reveal a dual-personality market. The median time to pending of just 19 days signals high velocity, yet the fact that 55.2% of properties sell for less than the list price indicates that county-wide averages are insufficient; property-level intelligence is mandatory for making informed decisions.
Strategic Implications
These conditions create distinct challenges and opportunities based on your role. Broader forecasts, like those for navigating the 2026 commercial real estate market, provide context for the entire ecosystem.
- For Real Estate Investors: The 55.2% of homes selling below list price represent the primary opportunity. Success requires sophisticated tools to identify these off-market or overlooked properties, as detailed in our 2025 Q4 Cuyahoga County Investor Pulse Report.
- For Mortgage Lenders: A high sale-to-list ratio and rapid sales cycle demand maximum efficiency in underwriting and closing. While the market's stability is positive, risk management requires monitoring micro-trends in specific zip codes.
- For Proptech Platforms: The market's velocity creates immense demand for accurate, real-time data. The winning platforms will be those delivering reliable AVMs, verified owner information, and instantaneous listing updates without latency.
What is driving Cuyahoga County home sales?
The market is driven by the classic economic conflict between relentless buyer demand and stubbornly low housing supply. This core imbalance, fueled by economic stability and relative affordability on the demand side and a chronic construction deficit on the supply side, is the primary force shaping market dynamics in 2026.
The Demand Side
Demand for Cuyahoga County home sales remains robust due to two primary factors.
- Economic Stability: A foundation built on major employers like the Cleveland Clinic provides a continuous stream of qualified buyers with financial security.
- National Affordability: Compared to coastal cities and Sun Belt markets, the county remains a bargain, attracting both local first-time buyers and relocating professionals seeking a lower cost of living.
The Supply Side
The supply side is characterized by a severe inventory crunch. New home construction has not kept pace with household formation for years, and existing homeowners are holding properties longer. This bottleneck restricts the total number of sales and exerts direct upward pressure on prices.
Market Signals vs. Reality
The surface-level data can seem contradictory without deeper analysis. Lower sales volume and slightly higher days on market are not signs of a collapsing market, but rather symptoms of a market under severe supply strain.
| Signal vs. Reality | Comparison Table |
|---|---|
| The Signal | The Reality |
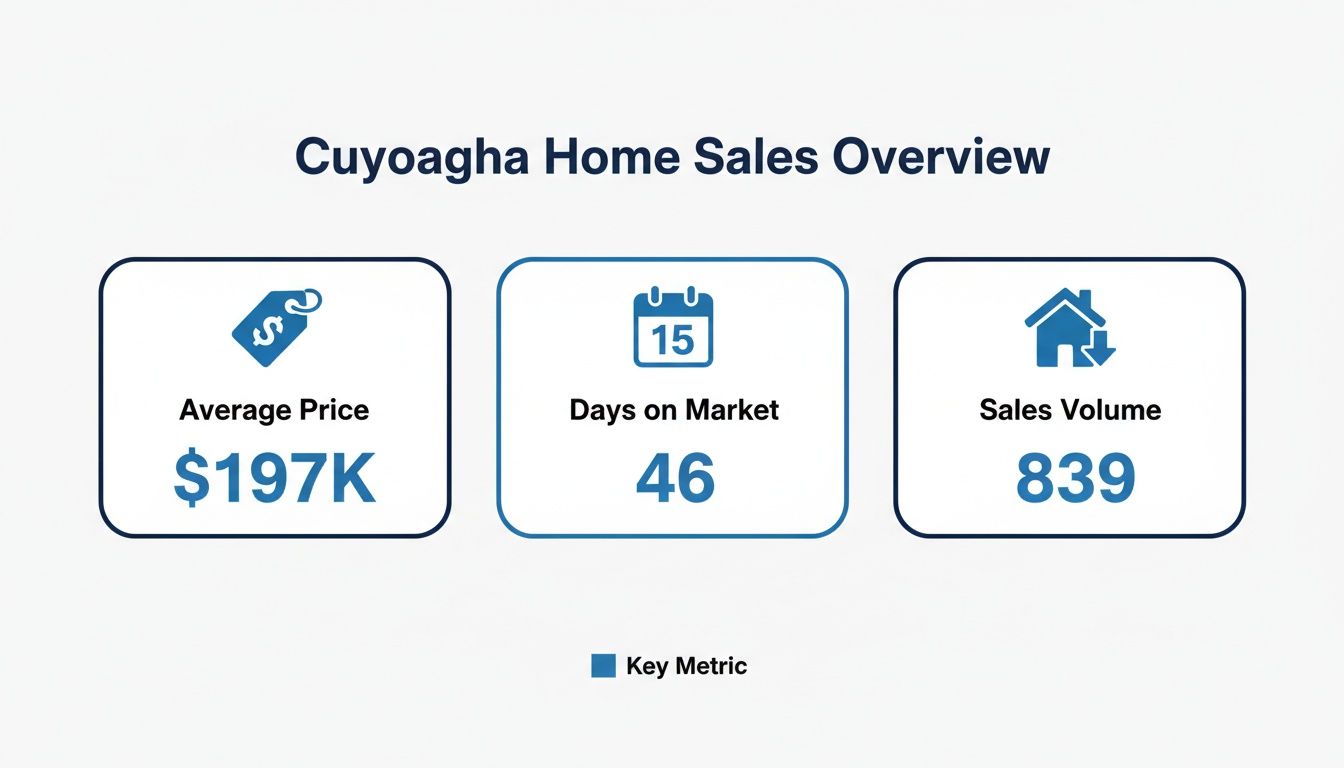
| Slightly higher average days on market (46 vs. 41 last year). | This isn't a drop in demand. It's buyers becoming more selective and less willing to engage in bidding wars for properties that aren't a perfect fit. |
| Lower total sales volume (839 vs. 944 last year). | This is a supply problem, not a demand problem. You cannot sell homes that are not for sale. The transaction count is limited by inventory. |
| Rising prices concurrent with fewer sales. | This indicates that scarcity is driving value. Intense competition is concentrated on a smaller pool of available homes, inflating prices for properties that do hit the market. |
How does historical price growth shape the 2026 market?
The stability of the 2026 Cuyahoga County home sales market is a direct result of years of steady, powerful appreciation. The All-Transactions House Price Index, a reliable measure of home price changes, shows a compound annual growth rate of over 8% between 2021 and 2025, establishing the momentum that underpins current property values.
The 2021-2026 Climb
Cuyahoga County's All-Transactions House Price Index surged from 135.06 in 2021 to an estimated 185.83 in 2025. This growth directly correlates with 2026 metrics, where average home values have reached $210,764 (a 4.8% annual increase) and the year-to-date median sale price is $217,000 (an 11.3% increase). This data is verifiable via the St. Louis Fed's economic research.
This consistent appreciation since 2021 demonstrates the market's underlying resilience and proves that demand for housing in Cuyahoga County remains fundamentally strong.
Applying Historical Data
This historical context provides a strategic advantage for various industry players.
- For Investors: Analyzing historical tax, assessment, and transaction records helps identify neighborhoods with consistent growth, revealing untapped potential before market saturation.
- For Lenders: The proven long-term appreciation, with the index growing from 152.64 in 2022 to 175.77 in 2024, gives confidence for loan origination and is critical for assessing portfolio risk.
- For Proptech: This data is the fuel for accurate Automated Valuation Models (AVMs). Knowing that 30.3% of homes sell over list while 55.2% sell under allows for the development of algorithms that predict sales velocity and price with high precision.
Where are the investment opportunities in Cuyahoga County?
The most valuable opportunities are not found in county-level averages but by segmenting the market by property type, price band, and geography. By dissecting the Cuyahoga County home sales data, investors can identify specific pockets of momentum and value that are invisible at a high level.

Single-Family Homes vs. Condos
| Property Type Comparison | Pros & Cons |
|---|---|
| Single-Family Homes (SFHs) | Pro: These are the market's workhorses, driving appreciation and attracting a broad buyer base, leading to stable long-term growth. Con: Higher capital outlay compared to condos. |
| Condos & Townhomes | Pro: Lower entry price attracts first-time buyers and cash-flow investors, often leading to faster sales in certain price bands. Con: Less appreciation potential and exposure to HOA risks. |
Price Band Performance
The most intense market activity is concentrated in the sub-$250k price band, which is crowded with first-time buyers and investors, resulting in multiple-offer situations and the shortest days on market.
| Cuyahoga County Market Segment Comparison |
|---|
| Segment |
| Starter Homes (<$200k) |
| Mid-Tier Homes ($200k-$400k) |
| Upper-Tier ($400k-$600k) |
| Condos/Townhomes (All Prices) |
The data is unequivocal: as prices rise, sales velocity and appreciation cool. The sub-$200k bracket is the market's engine.
Geographic Hotspots
Hyper-local analysis is crucial. While inner-ring suburbs are consistently in demand, second-ring suburbs that offer a blend of affordability and amenities are emerging as new hotspots. Proximity to job centers like the Cleveland Clinic is a massive driver for neighborhoods like Amherst. Granular analysis, down to the subdivision level, is required to find true gems, and using tools like a short term rental income calculator is essential for forecasting profitability on specific properties.
How can this data be applied strategically?
Market intelligence on Cuyahoga County home sales is only valuable when it is translated into actionable strategy. Turning data into a concrete plan is what separates market leaders from followers.
Playbook for Real Estate Investors
The mission is to find motivated sellers and off-market deals before the competition.
- Define Targeting Criteria: Filter for specific ZIP codes or census tracts that match your investment thesis, focusing on areas with rising prices or strong rental demand.
- Identify Motivation Signals: Within targeted areas, build lists of properties with high equity (>50%), long-term ownership (10+ years), or distress indicators like pre-foreclosure.
- Execute Direct Outreach: Use skip tracing to acquire verified contact information for owners on your list. A direct, personalized message to a motivated seller is far more effective than mass marketing.
Playbook for Mortgage Lenders
The objective is proactive risk management and opportunity identification.
- Refine Risk Models: Feed underwriting models with real-time sales comps, inventory levels, and days on market to ensure valuations are based on current, not historical, data.
- Monitor Portfolio Health: Implement alerts for properties in ZIP codes showing signs of cooling (e.g., rising days on market) to get ahead of potential risk.
- Target Refinancing: Use property data to identify homeowners with significant equity and high-rate mortgages, creating a pre-qualified list for high-conversion marketing campaigns.
Playbook for Proptech Companies
The goal is to build indispensable tools that provide customers with a clear competitive advantage.
- Enhance AVM Accuracy: Ingest the freshest transaction data, including off-market sales, to produce superior property valuations. See how geospatial analysis enhances automated valuation models for technical details.
- Power Lead Generation: Integrate property and owner data to enable users to build motivated seller lists directly within your platform.
- Deliver Hyper-Local Analytics: Create dashboards that allow users to visualize market trends at a granular level, revealing the "hot" and "cold" spots missed by high-level reports.
How can you build a winning data strategy?
A winning data strategy for the 2026 Cuyahoga County home sales market is not about having the most data, but about having the right data, delivered in real-time. Relying on stale, quarterly-updated records is a guaranteed path to failure in a market where the best properties are gone in 19 days.
Success in this market is determined by the team with the fastest, most accurate intelligence.
The Modern Data Stack
The required approach is to unify disparate data streams—tax records, assessments, market signals, and owner details—into a single, cohesive, developer-friendly ecosystem. This provides daily updates, not last month's news. This is how you build workflows that get ahead of market shifts instead of reacting to them.
From Data Points to Deals
The power of a modern data strategy lies in connecting the dots. When a pre-foreclosure is filed on a high-equity property, the right system doesn't just show the filing; it instantly provides the owner's verified phone number.
A winning playbook is built on three pillars:
- Unify Intelligence: Consolidate all property and owner data into a single source of truth.
- Demand Real-Time Updates: Your data must keep pace with the daily movements of the market.
- Build a Custom Edge: Use low-latency APIs to create custom dashboards, alerts, and workflows that align with your unique strategy.
By building a solid data foundation with a platform like BatchData, you stop chasing the market and start leading it.
What are the most frequently asked questions?
Here are direct answers to the most common questions about the Cuyahoga County home sales market.
What is the 2026 forecast for the Cuyahoga County housing market?
The forecast is for continued, steady price growth. The core driver is the persistent imbalance between strong buyer demand and low housing inventory. While the explosive appreciation of past years may moderate, the market will remain highly competitive, keeping sellers in a strong position.
Is now a good time to invest in Cuyahoga County real estate?
Yes, but only for data-driven investors. The market is bifurcated: 30.3% of homes sell above asking price, while 55.2% sell below. This creates distinct opportunities for fix-and-flip investors in high-demand areas and buy-and-hold investors in undervalued neighborhoods. Success depends entirely on using granular, real-time data to identify these opportunities before the rest of the market.
Which neighborhoods in Cuyahoga County are most popular?
Neighborhoods with strong schools, quality amenities, and easy commutes to major employers like the Cleveland Clinic consistently see high demand. However, "popularity" is a lagging indicator. The strategic approach is to use property data—filtering for sales velocity, price shifts, and inventory levels—to identify the next high-growth neighborhood before it becomes saturated.
How does Cuyahoga County compare to other Ohio markets?
Cuyahoga County often serves as a reliable bellwether for the Midwest. Its core dynamics—stable growth, relative affordability, and tight inventory—are mirrored in other Ohio metros like Columbus and Cincinnati. However, each market has unique local drivers, and assuming a strategy will work universally is a critical error.
Ready to stop using outdated records and start building a winning strategy for Cuyahoga County home sales? With BatchData, you can tap into the industry's most accurate, real-time property data to find opportunities no one else sees. Unify your data streams and gain a competitive edge today.