
Seasonal real estate trends can make or break your investment strategy. Here’s what you need to know:
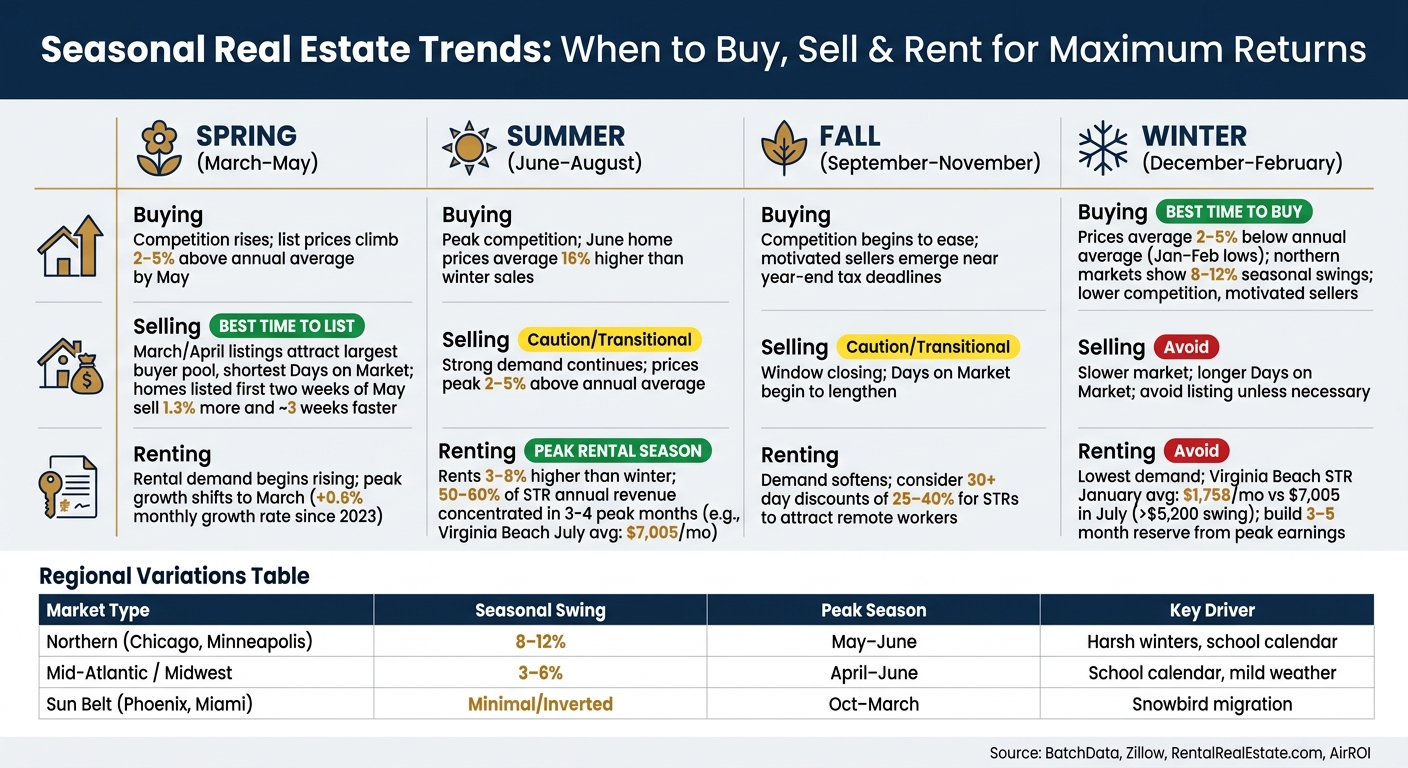
- Spring and summer are peak seasons for buying and selling, with June home prices averaging 16% higher than winter sales.
- Winter offers opportunities for buyers, with lower competition and motivated sellers.
- Rental income peaks May–August, with rents 3–8% higher than in winter.
- Timing matters: Align purchases, sales, and lease expirations with seasonal market cycles to maximize profits.
To succeed, track key metrics like median sale prices, Days on Market, and rent trends. Use tools like BatchData for real-time updates, enriched data, and predictive insights to stay ahead.
Seasonal Real Estate Trends: When to Buy, Sell & Rent for Maximum Returns
The Real Estate Seasonality Cycle Explained
Collecting Seasonal Real Estate Data
When it comes to making smarter property investments, understanding seasonal market trends is key. The first step? Collecting data that highlights these seasonal shifts. A well-rounded analysis starts with choosing the right metrics.
Key Data Points to Track
To uncover seasonal patterns, focus on tracking metrics like monthly median sale prices, sales volume (number of transactions), inventory levels, and Days on Market. These indicators shed light on market activity, supply constraints, and how quickly properties are being sold. If rentals are your focus, also include occupancy rates and monthly rent trends to get a clearer picture of income potential.
It’s crucial to analyze data spanning multiple years. Looking at just one year won’t help you separate regular seasonal trends from one-off economic events. For example, researchers studying U.S. housing trends have used data from 1991 to 2024 to identify recurring cycles while filtering out anomalies like economic downturns. Additionally, breaking down data by price tier (starter homes, mid-range, and luxury) and by region provides deeper insights since markets in the Northeast behave differently than those in the Sun Belt.
| Data Point | What It Reveals |
|---|---|
| Median Sale Price | Seasonal pricing trends and peak buying periods |
| Sales Volume | Transaction surges and market activity levels |
| Inventory Levels | Seasonal shifts in property availability |
| Days on Market | How fast properties sell in different seasons |
| Rent Trends & Occupancy | Seasonal rental income potential |
Once you’ve pinpointed the metrics that matter, the next step is finding reliable data sources.
Data Sources and Tools
Public sources like the FHFA House Price Index (HPI), the U.S. Census Bureau‘s SIPP data, and platforms such as Zillow and Redfin offer detailed market reports. However, these sources may not provide the granular, property-level details some investors need, such as tax histories or rent estimates.
For deeper insights, tools like BatchData are invaluable. BatchData pulls from over 3,200 sources and covers 99.9% of U.S. properties, offering access to more than 155 million property records. Features like bulk data delivery (in CSV or Parquet formats) help investors build historical datasets for year-over-year comparisons. Its property search API allows real-time inventory tracking, with daily updates to assessor data – far more frequent than the monthly or quarterly updates from many other sources. For those planning ahead, the BatchRank tool uses AI to predict which properties might sell within six months, giving investors a competitive edge.
Preparing and Cleaning the Data
Data from different sources often doesn’t align perfectly. Before diving into analysis, it’s important to standardize addresses and categorize properties consistently. This ensures your findings aren’t skewed by errors or mismatched data. Cross-checking sources and running automated quality checks can help identify gaps or outliers that might distort your results.
Messy data can lead to misleading conclusions, even if the analysis appears statistically sound. Clean, accurate data is the foundation for actionable insights – and it’s what sets the stage for making informed, strategic investment decisions in the next phase.
Analyzing Seasonal Patterns in Property Markets
Once your data is clean and organized, the next step is to dig into it and uncover seasonal trends. This process builds directly on the earlier data cleaning methods and focuses on identifying patterns that can inform decision-making.
Visualizing Seasonal Trends
One of the easiest ways to spot seasonal patterns is by creating line charts of key metrics like median sale prices, Days on Market, or monthly rent over several years. These charts often reveal recurring peaks and dips. For instance, in northern cities like Chicago or Minneapolis, harsh winters can cause buyer activity to drop significantly, leading to swings of 8–12% between the lowest and highest points of the year.
To filter out short-term fluctuations, you can use a three-month moving average (MA3). If there’s a noticeable difference between Year-over-Year (YoY) trends and Month-over-Month (MoM) changes, it’s a strong indicator that seasonal factors are at play.
"If YoY numbers differ a lot from MoM numbers, seasonality is likely present." – Ryan Nelson, Founder, RentalRealEstate.com
Once these patterns appear, it’s important to distinguish them from broader market shifts.
Separating Seasonal Trends from Long-Term Changes
The real challenge lies in telling seasonal trends apart from actual market changes. For example, a price increase in May could just be the usual spring demand, or it might signal a long-term upward trend. The best way to differentiate these is by using Year-over-Year comparisons – comparing June 2025 to June 2026, instead of June to July. This cancels out seasonal noise and highlights real market movement.
For a more detailed analysis, statistical tools like X-13ARIMA-SEATS decomposition can break down a time series into three parts: long-term trends, predictable seasonal shifts, and random noise. Many platforms automate this process, but understanding the output is key. The seasonal component shows typical monthly patterns, while the trend-cycle indicates where the market is heading. Interestingly, post-pandemic data reveals that seasonal peaks are arriving earlier in the year, often in March or April instead of the more traditional May–June period.
Segmenting Data for Deeper Insights
Looking at overall market averages can often hide important differences at the neighborhood or property level. For example, a "spring boom" in one zip code might happen a month earlier – or not at all – in another. By breaking data down by property type, price tier, and location, you can turn broad observations into actionable strategies.
Take single-family homes in suburban school districts, for instance. These properties typically show stronger summer seasonality because families plan moves around the school calendar. On the other hand, downtown condos often display weaker seasonality. In Sun Belt markets like Phoenix and Miami, the trends can even reverse, with demand peaking in winter (October–March) as snowbirds flock south. The table below highlights how seasonal intensity varies by market type:
| Market Type | Seasonal Swing | Peak Season | Key Driver |
|---|---|---|---|
| Northern (Chicago, Minneapolis) | 8–12% | May–June | Harsh winters, school calendar |
| Mid-Atlantic / Midwest | 3–6% | April–June | School calendar, mild weather shifts |
| Sun Belt (Phoenix, Miami) | Minimal / Inverted | Oct–March | Snowbird migration, year-round mild weather |
Breaking data down by price tier adds another layer of insight. Starter homes and mid-range properties often align closely with the school calendar, while luxury properties tend to follow different patterns, influenced by financial markets or local economic events. The more granular your analysis, the better equipped you’ll be to time purchases, adjust rent prices, and forecast cash flow. These detailed insights set the stage for the next section, where we’ll explore how to translate seasonal trends into actionable investment strategies.
sbb-itb-8058745
Turning Seasonal Insights into Investment Decisions
Seasonal insights can help you strategically time purchases, maximize rental earnings, and plan renovations effectively.
Timing Purchases and Sales
Leveraging seasonal data can significantly impact your investment returns. For buyers, the period from November to February offers a prime opportunity. During this "holiday slowdown", competition tends to drop, and sellers are often more motivated – especially as they approach year-end tax deadlines. Historically, residential prices hit their lowest point in January and February, averaging 2–5% below the annual average, while peaking in May and June at 2–5% above it. For northern markets, the seasonal price swings can be even more dramatic, ranging from 8–12%. This means patient buyers can secure meaningful discounts simply by timing their offers wisely.
On the flip side, sellers should aim to list properties in March or April, aligning with the peak buying season. This timing not only attracts the largest pool of motivated buyers but also results in shorter Days on Market. Adjusting your After Repair Value (ARV) based on seasonal comps is essential: increase the ARV when using winter comps for a spring sale and decrease it for a winter exit.
"The practical rule: adjust your ARV based on when you plan to exit, not just when your comps sold." – Deal Run
Beyond buying and selling, seasonal trends also play a pivotal role in rental strategies.
Optimizing Rental Income
For long-term rentals, aligning lease expirations with spring can yield higher rents. Properties listed during the peak rental season (May–August) typically command a 3–8% rent premium over those listed in winter. Interestingly, since 2023, the rental market has seen its peak growth shift earlier to March, with a +0.6% monthly growth rate, making it advantageous to list slightly ahead of the traditional summer rush.
Short-term rentals (STRs) require an even more dynamic approach. In highly seasonal markets, 50–60% of annual revenue may be concentrated in just 3–4 peak months. To maintain cash flow during off-peak periods, offering 30+ day stay discounts of 25–40% can attract remote workers and snowbirds while cutting down on turnover costs. Additionally, investing in amenities like high-speed internet (500+ Mbps), dedicated workspaces, or hot tubs can help broaden the property’s appeal beyond the typical peak-season traveler.
"In a beach market, seasonality is not a risk to manage – it is a structural feature to price around." – Jun Zhou, Founder, AirROI
Seasonal revenue swings can be stark. For example, in Virginia Beach, monthly revenue can vary by more than $5,200, with July bringing in approximately $7,005 and January dropping to around $1,758. A sustainable STR investment must account for its revenue floor, not just its peak potential.
"The seasonal floor, not the seasonal ceiling, determines whether an STR investment is viable." – AirROI
Seasonal changes also influence property maintenance and financial planning.
Planning Renovations and Managing Cash Flow
Seasonal shifts don’t just affect transactions and rentals – they also dictate the best times for property improvements and financial planning. Scheduling renovations during off-peak periods can ensure better contractor availability, potentially lower costs, and reduce the opportunity cost of having the property off the market. The goal is to have the property fully ready before the spring demand surge arrives.
To navigate slow months, it’s wise to build a peak-season reserve covering 3–5 months of fixed costs – including mortgage payments, insurance, and taxes – using the surplus income earned during high-demand periods. This financial cushion can prevent the need for distressed pricing during revenue dips.
"A property generating $8,000 in October might generate $3,500 in February. Both months are part of the same investment, and your mortgage doesn’t care which month it is." – Jack Costigan, Real Estate Agent/Investor
When evaluating a new property, avoid relying solely on annual averages. Instead, model cash flow month-by-month to ensure the property can handle slower months without resorting to below-cost pricing.
Building a Repeatable Seasonal Data System with BatchData
Seasonal analysis only becomes truly useful when data is refreshed, standardized, and enriched on a regular schedule. This transforms a one-time data pull into a dynamic view that allows for year-over-year comparisons.
Automating Seasonal Data Updates
Automation is the backbone of any reliable system. Relying on manual downloads of property records each month can lead to delays, errors, and inconsistencies, all of which can throw off seasonal comparisons. BatchData addresses this issue with two powerful delivery methods: a real-time RESTful API for quick, targeted lookups and bulk data delivery via Amazon S3, SFTP, or Google Drive for larger datasets.
For example, you can set up a weekly API job to fetch new single-family transactions in specific ZIP codes under a defined price range. At the same time, a monthly bulk file can provide a comprehensive snapshot of all active rentals in a metro area. Each data pull includes a data_as_of timestamp, ensuring that every seasonal comparison is tied to a specific point in time. Consistent formatting – like prices in $X,XXX.XX, dates in MM/DD/YYYY, and square footage in square feet – ensures clean and comparable data.
BatchData also offers a Smart Monitoring feature that takes automation a step further. By tracking a defined property list 24/7, it sends alerts when key changes occur, such as new pre-foreclosure filings or ownership transfers. This keeps your seasonal dataset updated in real time, so you’re not stuck waiting for – or forgetting about – manual updates.
"We want to supplement your work and make you superhuman so you can do things in seconds, not hours. That’s where BatchData comes in. What used to take 30 minutes now takes 30 seconds." – Chris Finck, Director of Product Management, BatchData
Using Data Enrichment for Better Analysis
Timely data is just the start. To make it actionable, data needs to be enriched. Raw property data often has gaps – missing square footage, incomplete bed/bath counts, or inconsistent addresses – that can distort seasonal metrics like price per square foot. BatchData’s property data enrichment bridges these gaps by pulling from tax assessor records that cover 99.9% of U.S. properties. This ensures that comparisons are based on complete, reliable data.
Address standardization takes this process further. BatchData normalizes addresses to USPS standards, appends ZIP+4 codes, and geocodes each record. This prevents duplicate entries when merging datasets from different sources. The result? Cleaner metrics, like "average winter days on market for verified detached homes in ZIP 85032", that investors can confidently use for high-stakes decisions.
For those running seasonal outreach campaigns – like targeting absentee owners or distressed sellers during off-peak times – BatchData’s contact enrichment and skip tracing adds up to five phone numbers and three email addresses per owner record. Paired with seasonal trends, this enables targeted campaigns without the need for manual research. These enriched datasets lay the groundwork for actionable, portfolio-wide insights.
Scaling Seasonal Analysis Across a Portfolio
Once your data is automated and enriched, scaling seasonal analysis across an entire portfolio becomes much easier. BatchData’s APIs and bulk delivery options allow you to apply consistent query structures and enrichment rules across properties – whether you’re analyzing 10 or 10,000.
The key is to assign a unique property identifier to every BatchData pull and load the output into a business intelligence tool like Power BI, Tableau, or Looker Studio. These platforms can aggregate seasonal KPIs by market, property type, or investment strategy. For instance, a dashboard might reveal that single-family rentals in the Midwest offer better acquisition opportunities in Q4, while Sunbelt markets show less seasonal variation. BatchData’s BatchRank™ propensity scores add another layer of insight, helping you identify which properties are most likely to sell within six months. This ensures that your capital is deployed strategically, in the right markets, and at the right time.
Conclusion and Key Takeaways
Seasonal data offers a structured way to navigate the rhythms of U.S. real estate markets. Buyer activity tends to peak in spring and early summer, leading to tighter inventory and increased competition. In contrast, late fall and winter often present longer market times, motivated sellers, and better negotiation opportunities for prepared investors. Zillow reports that homes listed during the first two weeks of May sell for 1.3% more and about three weeks faster than the annual average. For data-savvy investors, this timing advantage can be a game-changer.
The most successful investors don’t just observe these trends – they actively track them. Metrics like median sale price, days on market, sale-to-list ratio, and rental vacancy rates, analyzed monthly and segmented by ZIP code or property type, separate informed decisions from guesswork. It’s also crucial to differentiate between a typical January slowdown and a real market downturn by comparing data year-over-year. This is where seasonal decomposition and historical trends become practical tools.
But timing is just one piece of the puzzle. Seasonal insights also fine-tune strategies around rentals, renovations, and cash flow. For example, structuring lease expirations to align with peak rental demand (May through August), scheduling renovations during slower winter months, or setting aside reserves for predictable off-season income dips all become more strategic when backed by data rather than intuition.
Scaling these strategies requires a systematic approach. This isn’t about a one-time analysis but about creating a repeatable process. Tools like BatchData make this scalability possible. From API-driven data pulls and bulk property information to features like BatchRank™ propensity scores – which predict properties likely to sell within six months – BatchData equips investors with real-time, actionable insights. This transforms scattered data into a cohesive, portfolio-wide strategy.
Automation shifts the focus from reacting to anticipating. A well-organized, data-driven system, as outlined in this guide, lays the groundwork for staying ahead of market changes rather than chasing them.
"The question has shifted from, ‘Is this a good deal?’ to ‘What does the data say about this deal’s risk, potential, and portfolio fit?’" – BatchData
This shift – from instinct to evidence – is what seasonal data makes possible. Investors who integrate this approach into their standard process won’t just keep up with the market – they’ll stay ahead of it.
FAQs
How many years of data do I need to spot real seasonality?
To spot genuine seasonality in property data, it’s essential to analyze at least 2–3 years of data to build a dependable baseline. For deeper insights, many experts suggest looking at trends spanning 5–10 years. If you’re using advanced tools or time-series models, having at least 36 months of data can be particularly effective for identifying seasonal demand patterns. Companies like BatchData provide property data solutions designed to support these types of analyses, helping investors make smarter decisions by leveraging historical trends.
How can I separate seasonal swings from a true market shift?
To pinpoint genuine changes in the market, you’ll need to use seasonal adjustment techniques on your data. Start by examining historical trends to calculate a seasonal factor – essentially, a way to account for predictable fluctuations tied to specific times of the year. Once you’ve identified this factor, remove it from your data. This will help you uncover the underlying patterns that might otherwise be hidden.
Another helpful step is comparing year-to-date metrics with those from previous years. This can highlight any unusual deviations that stand out from typical seasonal trends. However, don’t forget to consider external influences – things like relocations or shifts in interest rates can disrupt normal seasonality and skew your results.
If you’re looking for detailed property data to aid in this type of analysis, BatchData offers resources that can help you dig deeper and identify actual market changes.
What’s the best way to time buys, sells, and lease renewals by season?
To make smarter property decisions, timing is everything. If you’re looking to buy, aim for the quieter months from November to February. During this period, there’s typically less competition, which can lead to better deals and more room for negotiation. On the other hand, if you’re planning to sell, spring and summer – March through August – are ideal. These months tend to bring in more buyers, increasing your chances of receiving higher offers.
For lease renewals, take a close look at past occupancy trends. Adjust lease terms to end during the peak summer months when demand is higher. This strategy helps you avoid off-season vacancies and boosts your rental income potential.