
Real estate markets move fast, and relying on outdated reports can leave you behind. Here’s what you need to know:
- Current Trends (May 2026): Housing inventory is up 20% year-over-year, existing home sales are climbing 14%, and listing prices have dropped 2.4% – marking 19 weeks of price declines.
- Why Real-Time Data Matters: Leading signals like price cuts and new listings provide actionable insights, while lagging indicators (e.g., closed sales) reflect past trends.
- The Role of Scalable Pipelines: A robust pipeline processes real-time data efficiently, handling challenges like latency, regional fragmentation, and seasonal spikes.
Key Takeaway: Real-time pipelines empower faster, data-driven decisions, helping investors and firms stay ahead in competitive markets.
Best Practices for Real-Time Analytics Pipelines! Guide to Designing Real-Time Analytics Pipelines!
sbb-itb-8058745
How to Build a Scalable Real Estate Data Pipeline
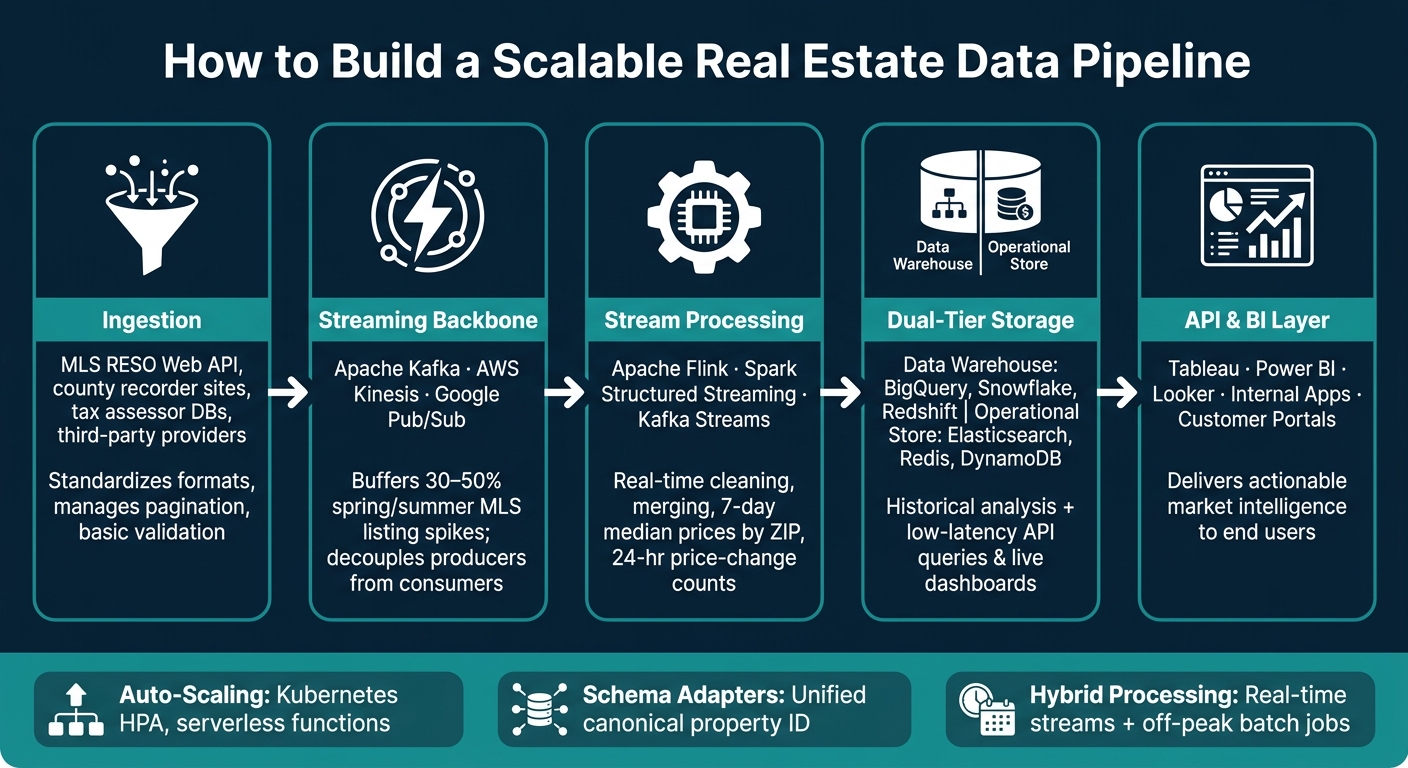
How to Build a Scalable Real Estate Data Pipeline: 5 Key Stages
Creating a pipeline that can handle the complexity of U.S. real estate data requires a layered approach. Each layer serves a specific purpose, and together they form a system capable of managing everything from small-scale changes in a single ZIP code to large-scale shifts across the country – all while maintaining performance under heavy loads.
Core Components of a Scalable Pipeline
A scalable data pipeline operates through five key stages, each building on the previous one.
Ingestion is the starting point, where raw data flows into the system. This involves connectors that pull data from various sources like MLS RESO Web API feeds, county recorder sites, tax assessor databases, and third-party providers. These connectors standardize data formats, manage pagination, and perform basic validation before passing it along.
Next comes the streaming backbone, which acts as a buffer between data producers and consumers. Tools like Apache Kafka, AWS Kinesis, or Google Pub/Sub ensure that sudden spikes in data – like the 30–50% surge in MLS listings during the spring and summer months – don’t overwhelm downstream processes.
The stream processing engine (commonly Apache Flink, Spark Structured Streaming, or Kafka Streams) then takes over. This layer performs real-time transformations, such as cleaning data, merging it with reference information, and calculating metrics like 7-day median prices by ZIP code or 24-hour price-change counts.
Processed data is stored in two tiers: a data warehouse (like BigQuery, Snowflake, or Redshift) for historical analysis and low-latency operational stores (such as Elasticsearch, Redis, or DynamoDB) for quick API queries and live dashboards. Finally, the API and BI layer makes this data accessible through internal applications, customer portals, or tools like Tableau, Power BI, and Looker.
"A property data solution’s core function is to execute a three-step process: ingest raw data, enrich it with computed intelligence, and deliver it through a flexible, usable format." – BatchData
With the pipeline structure established, the next step is understanding the data sources that fuel it.
Real Estate Data Sources to Know
U.S. real estate data is notoriously fragmented, with hundreds of MLSs operating independently. Each MLS has its own schema, rules, and geographic focus, making near-real-time ingestion a necessity rather than an option.
Beyond MLS feeds, a robust pipeline also incorporates data from county recorder and assessor records (covering deed transfers, sale prices, assessed values), property tax databases (including millage rates and delinquency statuses), and parcel and geospatial data (such as zoning codes, flood zones, and school district boundaries). Each of these sources fills in gaps left by the others. For example, public records often capture off-market transactions that MLS data misses.
For teams needing national coverage without building individual scrapers for each county, providers like BatchData offer consolidated property and contact data. Their database spans 155 million+ U.S. property records with over 1,000 attributes per property. This kind of comprehensive coverage can save significant time and effort when scaling across multiple markets.
Once you’ve identified your data sources, the focus shifts to ensuring the pipeline can handle both high volumes and regional fragmentation efficiently.
Strategies for Scalability and Performance
After assembling the core components, the challenge becomes managing seasonal volume spikes and regional data fragmentation – two of the biggest hurdles in real estate pipelines.
For handling spikes, implement auto-scaling on ingestion and processing clusters. Tools like Kubernetes Horizontal Pod Autoscaler, serverless streaming functions, or auto-scaling for data warehouses can dynamically adjust resources. Combine this with backpressure management in your streaming layer to prevent failures during peak listing periods.
To address fragmentation, build adapter modules that map each MLS’s unique schema to a unified internal model. Centralizing this logic ensures that adding a new MLS region is a straightforward configuration change rather than a complex engineering task. Standardizing on a canonical property ID is equally critical, as it links MLS listings, assessor records, tax payments, and CRM events, simplifying deduplication as the system grows.
Finally, adopt a hybrid processing model to balance cost and performance. Stream real-time events for metrics that need immediate updates, while scheduling heavier batch jobs during off-peak hours to save on compute expenses. This approach delivers timely insights without the need for constant, resource-intensive processing.
Processing Patterns for Real-Time Market Intelligence
Once you’ve built a scalable pipeline, the next step is figuring out how to process incoming real estate data into actionable insights. Raw event streams don’t automatically translate to useful information. The way you process that data determines whether your system quickly identifies trends or gets bogged down in irrelevant noise.
Using Sliding and Tumbling Windows for Trend Detection
Windowed aggregation is a key method for transforming continuous event streams into time-based metrics. Two common approaches – tumbling windows and sliding windows – are especially useful in real estate analytics, depending on what you want to measure.
- Tumbling windows break time into fixed, non-overlapping intervals. For example, you might count new MLS listings per ZIP code every hour from 9:00 a.m. to 5:00 p.m. ET. These are perfect for dashboards, tracking daily KPIs, or comparing metrics like "new listings this Tuesday vs. last Tuesday."
- Sliding windows, on the other hand, continuously update metrics over overlapping time intervals. A 30-minute sliding window with 5-minute updates could highlight trends like a 5% increase in median list price per square foot in a specific ZIP code over the last 30 minutes compared to the previous two hours. This makes sliding windows great for real-time alerts.
Metrics like the number of new listings, pending offers, median and average list prices (in USD), average days on market, and absorption rates can all be tracked per ZIP code or neighborhood. For instance, a Phoenix investor might use a 14-day sliding window for median list price per square foot, with alerts triggered by a 3% price drop – providing a clear signal to act.
This approach lays the groundwork for combining real-time insights with historical data for even deeper analysis.
Combining Stream and Batch Processing for Deeper Analysis
While windows provide immediate insights, richer analysis often requires blending live data streams with historical datasets. Two common architectural patterns – Lambda and Kappa – can handle this need effectively.
- Lambda architecture splits incoming events into two layers: a streaming layer for low-latency metrics and a batch layer for recalculating historical data. For example, the streaming layer might alert you to a spike in new listings in Los Angeles County over the last 15 minutes, while the batch layer computes long-term metrics like 10-year price trends by ZIP code. A serving layer then combines these views into a unified dataset for dashboards and APIs.
- Kappa architecture simplifies things by using the stream itself as the system of record. Events can be replayed for historical recomputation, cutting down on operational complexity but requiring careful planning for data retention.
Historical datasets that work well with real-time streams include long-term listing and transaction histories (spanning 5–10 years), seasonal trends from previous years, macroeconomic indicators like mortgage rates and job growth, and enriched property data (e.g., owner profiles, equity estimates, absentee ownership). Combining these datasets with live streams allows for powerful insights, like forecasting 90-day price changes by ZIP code or spotting neighborhoods where investor activity is ramping up ahead of market shifts.
Maintaining Data Quality in Real-Time Streams
Poor data quality in real estate streams can be expensive. Issues like inconsistent schemas across MLS feeds, missing square footage data, malformed price fields, or duplicate listings can skew your metrics if not addressed early.
A schema registry is one of the best tools for maintaining data quality. With formats like Avro or JSON Schema, you can enforce strict rules for incoming data. Fields such as list price (in USD), beds, baths, square footage (in sq ft), and ZIP code must match their expected types and ranges. Schema evolution rules allow for adding new fields without breaking downstream systems. For example, any event with a negative list price, zero square footage for a single-family home, or an invalid ZIP code should be rejected or flagged for review.
Consistency is critical. Numeric values should follow U.S. conventions, using a period as the decimal separator and commas for thousands (e.g., $425,000). Timestamps should be stored in UTC while retaining local time zones (Eastern, Pacific, etc.) for display purposes.
To handle late or out-of-order events – which are common with MLS feeds and third-party integrations – use watermarks to define how long the system waits before closing a window. For instance, if an MLS partner typically delays updates by up to two hours, set your watermark threshold accordingly. Deduplication, using composite keys like listing_id + event_time, ensures that duplicate updates don’t inflate your metrics. Any data that fails validation should be routed to a dead-letter queue (DLQ) so engineers can analyze the issues and fix upstream problems.
The Role of Data Enrichment in Real-Time Pipelines
When working with real-time data pipelines, data enrichment plays a key role in turning raw information into actionable insights. While validated event streams are important, raw data often lacks the necessary context for immediate use. Enrichment bridges this gap by adding meaningful attributes to events before they reach analytics tools or decision-making systems.
What Is Data Enrichment?
Data enrichment is the process of enhancing raw records by appending additional details from other datasets, whether internal or external. For example, a basic MLS listing might only include an address and list price. Enrichment would add information like lot size, year built, market value, last sale details, zoning, school district, and even financial indicators like liens or estimated equity. Similarly, for a contact or lead record, enrichment could verify phone numbers, confirm email deliverability, flag Do Not Call (DNC) or TCPA litigator status, and identify absentee ownership or corporate structures.
This process fills in missing details, standardizes data formats, and provides critical context. Take a raw lead form with just a name, phone number, and ZIP code. After enrichment, that record might include a verified phone number, normalized USPS address, estimated home value, equity tier, and whether the owner is an investor or an owner-occupant. According to Experian, 30% of customer and prospect data is inaccurate, and 91% of organizations struggle with data quality issues that impact their ability to use data effectively. Enrichment is the tool that addresses these challenges, making it a key component of any data pipeline.
How to Integrate Enrichment Services into Your Pipeline
Data enrichment can occur at several stages in a pipeline: during ingestion, in-stream, or after the stream. The timing depends on how quickly enriched data is needed downstream.
- For time-sensitive workflows, synchronous enrichment is ideal. For example, routing a new lead to an investor within seconds of a distressed property appearing in a target ZIP code. Here, the stream processor uses an enrichment API in real-time, relying on a normalized address or APN as the lookup key. To optimize performance, frequent lookups can be cached in-memory (e.g., using Redis), and strict timeouts (100–200 ms) ensure the pipeline runs smoothly. If the enrichment service doesn’t respond quickly, the event can be flagged as
enrichment_pendingand proceed with its existing attributes. - For more extensive enrichment tasks, asynchronous processing is more efficient. This approach works well for activities like deep owner profiling, skip tracing property owners, or retrieving full property histories. Records are batched and sent to an enrichment provider’s bulk endpoints. Once the results are returned, they update master property or contact tables, ensuring future events automatically benefit from the enriched data without triggering new calls.
BatchData supports both approaches. Its APIs handle real-time lookups for synchronous needs, while its bulk delivery endpoints (integrated with platforms like Amazon S3, Google Drive, or SFTP) support asynchronous workflows. BatchData’s extensive database includes over 155 million properties with more than 700 attributes and 600 million records spanning property, address, and phone data. For contact enrichment, it can provide up to 5 phone numbers and 3 emails per property record, complete with built-in phone verification and DNC/TCPA scrubbing.
"We want to supplement your work and make you superhuman so you can do things in seconds, not hours. That’s where BatchData comes in. What used to take 30 minutes now takes 30 seconds." – Chris Finck, Director of Product Management, BatchData
By integrating these methods, enriched data becomes a reliable foundation for faster, more accurate decisions.
Business Impact of Enriched Real Estate Data
Enriched data enhances lead quality, improves segmentation, and speeds up decision-making processes. For instance, when lead records include verified contact details, property equity estimates, ownership status, and market velocity metrics, scoring models gain far more reliable inputs. BatchData reports a 76% right-party contact accuracy on enriched contact data, which is three times the industry average.
For segmentation, enrichment enables firms to distinguish between high-equity homeowners and underwater borrowers, owner-occupants and absentee landlords, or individual owners and corporate LLCs. Each of these groups requires tailored outreach strategies. Companies leveraging enriched pipelines can identify investment opportunities weeks ahead of competitors still using static lists. Across thousands of properties and ZIP codes, this lead time translates into stronger deal flow and a sharper competitive edge. By embracing enriched data, firms can stay agile and respond quickly to market changes, ensuring they remain ahead of the competition.
Managing and Scaling Real-Time Pipelines
Once your enriched data is moving through the pipeline, the challenge becomes keeping it running smoothly, reliably, and cost-effectively. This involves paying close attention to monitoring, resilience, and cost management.
Monitoring and Observability for Real Estate Data Pipelines
Monitoring is the backbone of keeping your pipeline efficient. The key metrics to track include consumer lag, end-to-end latency, throughput, and error rate. For example, consumer lag tells you how far behind your processing is – like if a price update takes 10 minutes to process, your dashboards and alerts will be outdated. End-to-end latency measures the time from when an MLS update enters your system to when it’s visible in search results or analytics. A good benchmark for high-priority U.S. metro feeds is keeping the median lag under 30 seconds and the 95th percentile below 2 minutes.
Another critical metric is dead-letter queue (DLQ) volume, especially when broken down by data source. A spike in DLQ events for a specific MLS feed might indicate a schema change by the provider. To troubleshoot quickly, use structured logging with correlation IDs that connect a property ID, MLS listing ID, and enrichment request ID. This setup enables engineers to trace issues from ingestion to storage in minutes rather than hours. Tools like Prometheus and Grafana, or managed options like Datadog and CloudWatch, are excellent for this purpose. Organize dashboards by pipeline stage and data source, not just by infrastructure, so problems in a specific feed don’t get lost in aggregate data. This clear approach to observability lays the groundwork for a resilient system.
Building Resilience into Distributed Systems
With observability in place, the next step is ensuring resilience to keep your pipelines running even when failures occur. Failures are inevitable, but the goal is to minimize their impact. For real estate pipelines, the best strategy combines retries with exponential backoff, checkpointing, and dead-letter queues, all tailored to the importance of the data.
For external service calls, such as enrichment APIs or geocoding, use exponential backoff with jitter and cap total retry time at 30–90 seconds for non-enrichment steps. When it comes to ingestion, keep retry windows even shorter. Enable checkpointing every 30–60 seconds in frameworks like Apache Flink or Spark Structured Streaming, saving state snapshots to durable storage like Amazon S3. This ensures that if a job restarts after a failure, it resumes from where it left off, avoiding hours of reprocessing.
Another crucial practice is idempotent processing, which ensures the same event isn’t applied multiple times. Use natural keys like property_id + event_timestamp to achieve this. To prevent bottlenecks, isolate pipelines for critical updates like price changes and status updates from less urgent workloads, such as engagement analytics. This separation ensures that a spike in one stream doesn’t disrupt others.
Once resilience is addressed, the focus shifts to balancing cost with performance.
Balancing Cost and Performance
Even the most resilient and observable systems can become expensive if costs aren’t managed carefully. Cloud streaming costs typically grow with data volume, and without oversight, expenses can spiral. For instance, Amazon Kinesis charges by shard-hour and payload size, while Confluent Cloud bills based on data volume and partition count. A nationwide U.S. real estate pipeline processing 50,000–200,000 events per minute during peak hours can rack up significant monthly costs.
The best way to manage these costs is through autoscaling. Adjust consumer groups and processing clusters dynamically based on lag and CPU usage, then scale down during low-traffic periods, like late nights. Pair autoscaling with efficient serialization to minimize payload sizes. For enrichment-heavy steps, streamline the process by running enrichment asynchronously in parallel and merging results downstream, instead of blocking the main stream for each API call. Lastly, optimize window sizes to match business needs. Use minute-level windows for operational alerts and hourly or daily windows for trend analysis. Overly granular windows often waste compute resources without adding much value to the business.
Conclusion: Staying Ahead of Market Trends with Scalable Pipelines
Real-time real estate pipelines are the key to transforming raw market signals into actionable insights. Speed without precision creates chaos, while precision without speed leaves you behind. A well-constructed pipeline – designed for agile ingestion, real-time processing, and effective data enrichment – delivers timely and dependable market intelligence. By prioritizing data quality and incorporating observability and resilience, these systems remain dependable during critical moments, like early-morning MLS updates or end-of-month spikes in closings.
The results speak for themselves. For example, a mid-sized single-family rental fund that streams listing data and sets alerts for properties meeting specific equity and rent-to-price criteria can cut one day off its days-to-offer timeline and boost accepted offers by 20%. Likewise, a multifamily operator tracking rent comps and lead volumes in rolling 7-day windows can adjust pricing and incentives before rising vacancies start to impact net operating income.
These examples highlight the importance of integrated data enrichment. Enrichment enhances everything from outreach to underwriting. Tools like BatchData fit seamlessly into this process, offering instant access to over 155 million U.S. property records, each enriched with 500 to 1,000+ data points. They also provide features like skip tracing, phone verification, and contact enrichment through real-time APIs or bulk delivery. As Chris Finck, BatchData’s Director of Product Management, explains:
"We want to supplement your work and make you superhuman so you can do things in seconds, not hours. That’s where BatchData comes in. What used to take 30 minutes now takes 30 seconds."
To get started, focus on a single impactful use case – like real-time alerts for acquisitions in targeted ZIP codes. Build observability into your system from the beginning, and expand strategically. This kind of scalable infrastructure evolves alongside your business, ensuring you stay ahead of market trends.
FAQs
What real-time signals matter most in a housing market?
When analyzing the real estate market, it’s crucial to focus on signals that highlight shifts in supply, demand, and financial distress. Here are some key metrics to keep an eye on:
- Active listing counts: These help gauge the available inventory in the market.
- Pending ratio: This metric shows the balance between active listings and properties under contract, offering insight into market momentum.
To assess buyer demand, look at the median days on market – a shorter timeframe often signals stronger demand. For seller pressure, track the frequency of price decreases, which can indicate how motivated sellers are to close deals.
Financial indicators can also provide early clues about market changes. Keep an eye on metrics like new liens, pre-foreclosure alerts, and ownership transfers. These data points can help identify motivated sellers well before such changes appear in slower public record updates.
How do I pick window sizes for alerts vs. dashboards?
When deciding on window sizes, think about your objectives. For real-time alerts, configure them to activate only when specific thresholds are exceeded – this helps prevent overwhelming users with too many notifications. For dashboards, the refresh frequency should align with the importance of the metrics. For instance, financial data might only need nightly updates, while property updates may require real-time refreshes.
There are two main types of windows to consider:
- Tumbling windows: These operate on fixed intervals, making them ideal for summarizing data over consistent time periods.
- Sliding windows: These provide continuous updates but come with higher computational costs.
To ensure your alerts and dashboards are powered by accurate and enriched data, rely on BatchData for processing and delivery.
Where should enrichment happen in a real-time pipeline?
In a real-time pipeline, enrichment needs to happen directly within the event-driven workflow, not through delayed batch processes. Set up your system to trigger an API call – like one to BatchData – as soon as a new property record enters the pipeline. This approach ensures critical details, such as ownership history and contact information, are added instantly. By doing so, your data remains current and aligned with evolving market trends, keeping the entire workflow smooth and efficient.