Insurance underwriting has become faster and more accurate with property data APIs. These tools replace outdated manual processes by providing instant access to detailed property information, such as roof age, flood zone proximity, and renovation history. With data pulled from reliable sources like county records and FEMA, underwriters can reduce errors by up to 80% and cut processing time from days to minutes.
Key Takeaways:
- What are Property Data APIs? Tools that deliver structured property details (e.g., square footage, risk factors) via automated queries.
- Benefits for Insurers: Improved accuracy (95% match rate), faster processing (batch queries for 1,000+ properties), and smarter risk assessments.
- Choosing API Providers: Look for high data accuracy (99%+), broad U.S. coverage, and ease of integration.
- How to Use APIs: Integrate endpoints for structural, geographic, and historical data into underwriting workflows to calculate risk scores.
- Automation Potential: Scale operations with bulk data processing and real-time monitoring to manage large property portfolios efficiently.
By leveraging property data APIs, insurers can save time, reduce costs, and make more informed decisions.
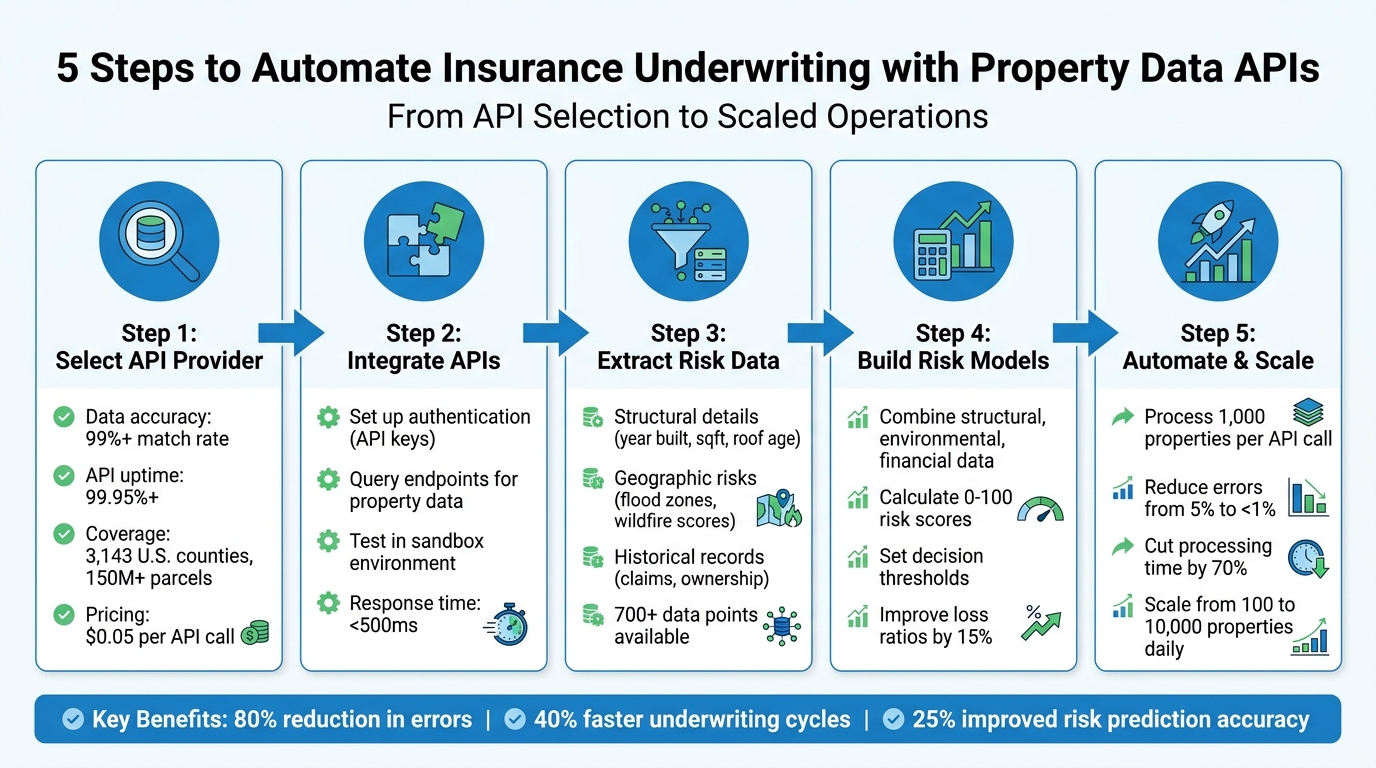
5-Step Property Data API Integration Process for Insurance Underwriting
AI-powered Property Intelligence for Insurers Via Maps Analysis & Structural Engineering Expertise
sbb-itb-8058745
Step 1: Select a Property Data API Provider
Picking the right property data API provider is a key step in ensuring accurate risk assessment. A poor choice can result in incomplete data, system outages during peak quoting times, or drawn-out integration processes. On the other hand, a reliable provider will deliver real-time, precise property data, which is essential for optimizing underwriting. Here’s what to consider when evaluating an API provider.
What to Look for in an API Provider
- Data accuracy: This is non-negotiable. Look for providers with verified match rates above 99% against public records. This minimizes errors in underwriting and ensures you’re working with reliable data .
- API uptime: Downtime can be costly, especially during high-demand periods. Providers should guarantee at least 99.95% uptime and offer redundant endpoints to avoid interruptions.
- Comprehensive U.S. property coverage: Ensure the provider covers all 3,143 U.S. counties, includes data for over 150 million parcels, and offers geocoding accuracy above 95%.
- Ease of integration: Opt for RESTful APIs with OAuth2 authentication and JSON responses. Features like pre-built connectors for underwriting platforms, sandbox environments for testing, and 24/7 support make integration smoother .
Why BatchData Works for Insurance Underwriting
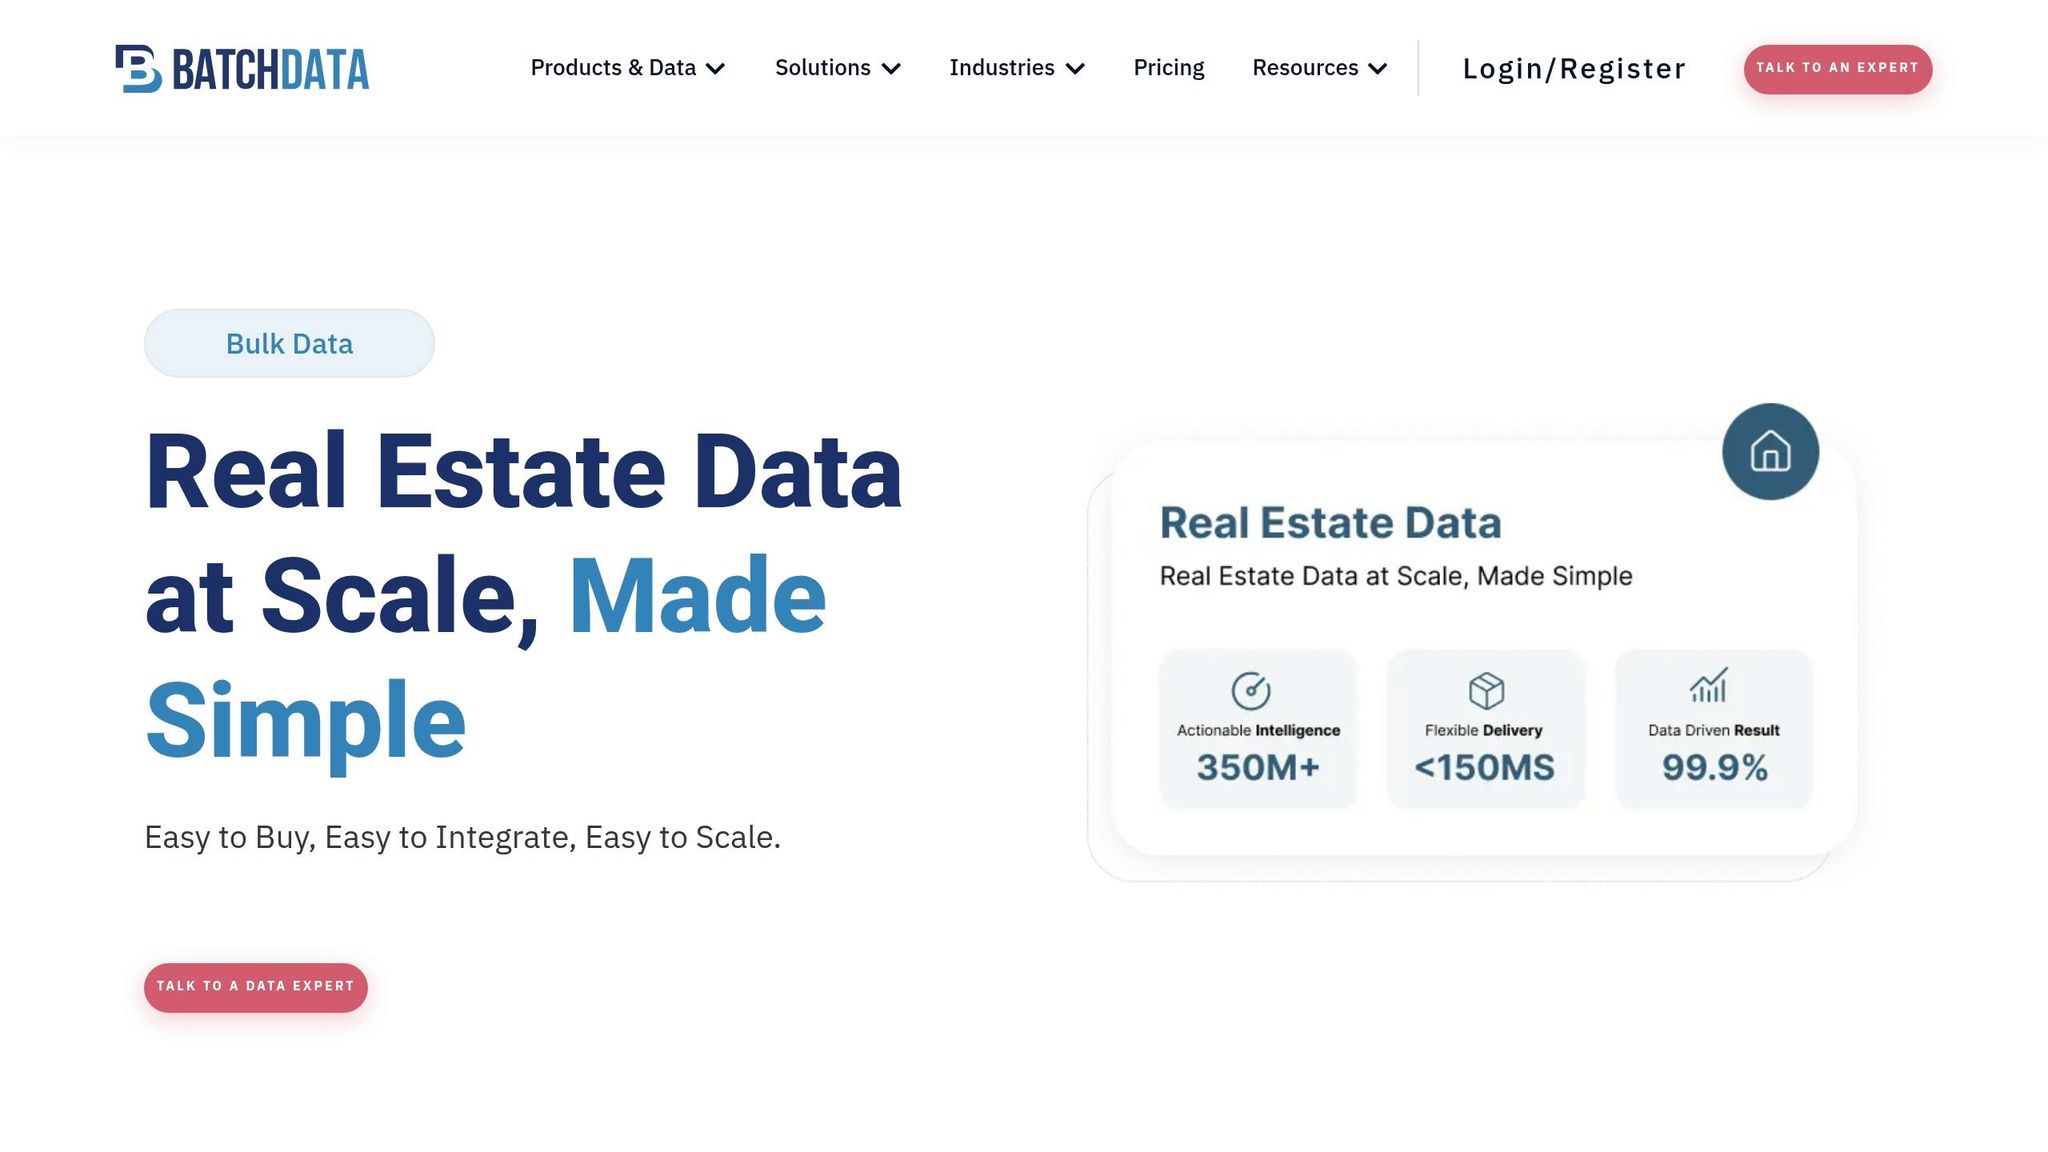
BatchData checks all the boxes when it comes to these criteria – and then some.
The platform provides instant access to risk-specific data for over 155 million U.S. properties. Users can search by address or APN (Assessor’s Parcel Number) to retrieve structured JSON data, including details like year built, condition scores, flood zone classifications, and lien records. This capability ensures same-day policy quotes, even during busy periods.
For high-volume needs, BatchData offers bulk data delivery through SFTP or CSV formats. This approach is cost-effective, with nightly pulls of over 1 million records costing 50–70% less per record than real-time API calls. It’s particularly useful for tasks like portfolio renewals and catastrophe modeling. Additionally, custom data extracts can cut manual data entry by up to 80%, saving time and reducing the need for dedicated analyst teams .
BatchData also provides tailored solutions for underwriting challenges. Its white-labeled dashboards allow underwriters to access property intelligence directly, without switching systems. Specialized API endpoints supply climate risk scores – such as wildfire susceptibility – directly into risk models. One insurer even reported a 15% reduction in loss ratios using these machine learning-enhanced datasets.
With flexible pricing starting at $0.05 per API call and bulk options ranging from $500 to $5,000 per month for over 1 million records, BatchData offers scalability without stretching your budget.
Step 2: Integrate APIs into Your Underwriting Workflow
After selecting your API provider, the next move is connecting their API to your underwriting system. This connection ensures a secure and direct link between your software and property intelligence databases, enabling quick access to structured data. The integration process involves two essential steps: setting up authentication and querying the appropriate endpoints to gather risk-specific details. Here’s how to handle each step.
Set Up API Access and Authentication
Start by signing up for an account on the provider’s developer portal – such as BatchData’s platform – and verifying your insurance credentials. Once registered, generate an API key via the dashboard. This key serves as your unique identifier for all API requests and should be kept secure.
To protect your API key, store it in environment variables or a secrets manager rather than embedding it in your app’s source code. For example, when working with BatchData, include the key in the x-api-key header for your requests. Here’s a Python example:
import requests import os api_key = os.getenv('BATCHDATA_API_KEY') url = 'https://api.batchdata.io/properties/123-Main-St-Chicago-IL' headers = {'x-api-key': api_key, 'Content-Type': 'application/json'} response = requests.get(url, headers=headers) if response.status_code == 200: data = response.json() print(data['sqft'], data['year_built']) # Outputs e.g., 2000, 1995 else: print(f"Error: {response.status_code}") Before going live, test your setup in a sandbox environment. To enhance security, rotate your API keys every quarter and use IP whitelisting to limit access during automated processes.
Be prepared to troubleshoot common errors:
- 401 Unauthorized: This indicates an invalid or expired key. Regenerate the key and test again.
- 429 Too Many Requests: Slow down your requests using exponential backoff and retry after 60 seconds.
- 404 Not Found: Double-check the address formatting (e.g., "123-Main-St,Chicago,IL,60601") to ensure accuracy.
Always log full responses for debugging and refer to the API documentation for address normalization guidelines specific to the U.S.
Query Property Data for Risk Assessment
Once authentication is set, you can start pulling property data using endpoints like /properties/{address}. These endpoints provide essential structural details such as square footage, year built, and condition scores – key factors for assessing risk. For example, a GET request to https://api.batchdata.io/properties/123-Main-St-Chicago-IL might return JSON data like this:
{ "sqft": 2000, "year_built": 1995, "condition_score": 8 } For geographic risks, use endpoints like /properties/{address}/risks or /geo-risks?lat=41.8781&lon=-87.6298. These endpoints deliver insights such as FEMA flood zone classifications (e.g., "Zone AE, 1% annual chance"), wildfire risk scores (on a 0–10 scale), and distances to hazards in miles. A sample response might look like this:
{ "flood_zone": "X", "wildfire_risk": 3.2, "distance_to_coast": "500 miles" } Integrate these API calls into your underwriting workflow by triggering data queries when a new policy is submitted. Use webhooks or scheduled jobs to parse JSON responses into your CRM fields and cross-check the data with manual records for accuracy. Test endpoints using sample addresses to verify reliability. Additionally, monitor performance metrics like response times (aim for under 500 milliseconds), uptime (99.9% SLA), and quota usage to avoid unexpected costs during high-demand periods.
Step 3: Extract and Analyze Risk Data Points
Once you’ve secured API access, the next step is extracting the property attributes that influence risk assessments. While APIs can provide hundreds of data points for each property, it’s smart to focus on three main areas: structural characteristics that affect replacement costs, location-based environmental hazards, and historical patterns that reveal trends over time. Each of these categories requires specific endpoints and analysis methods to turn raw data into actionable risk insights. Using your API integration, these key data points will help refine your risk models.
Property Condition and Structure Details
Start by pulling key structural data – like the year built, square footage, and property type (e.g., single-family, mixed-use, commercial) – via endpoints such as /properties/{address}. These attributes are critical for determining building code compliance and baseline replacement costs. For instance, a 2,000 sq ft home built in 1995 will face different risks related to material degradation compared to a 2020 construction with modern fire-resistant materials.
Roof details are especially important. Extract data on roof age, material (e.g., asphalt shingles, metal, tile), and reinforcement systems. Many APIs also offer specialized scores, such as "Snow Load Scores" for weight-bearing capacity and "Frozen Pipe Scores" for insulation quality in colder regions.
Don’t overlook construction materials like hurricane-rated windows, storm shutters, or the foundation type. For example, in September 2025, Google Cloud reported that CNA Insurance used satellite imagery combined with vector data to identify resilience factors like minor elevation changes and firebreaks. Such granular data can distinguish a 1960s ground-level home from a modern elevated remodel.
Renovation details – like kitchen, bathroom, or garage updates – also play a role in replacement costs. Keep in mind the "80% rule": properties must be insured for at least 80% of their replacement cost to avoid co-insurance penalties. If a property is underinsured (e.g., 75% of the required limit), an insurer may only cover 75% of a partial loss. For example, on a $50,000 claim, the payout could drop to $37,500. Always differentiate between Market Value (which includes land) and Replacement Cost Value (which excludes land and focuses on rebuilding costs) when setting policy limits.
Geographic and Environmental Risks
Use endpoints like /properties/{address}/risks or /geo-risks?lat=41.8781&lon=-87.6298 to gather location-specific hazard data. Modern APIs simplify environmental information into standardized risk scores for quicker decisions. For example, instead of just noting a flood zone, request flood depth metrics and return period data. For wildfire risk, gather information on fire zones and proximity to historical burn areas.
In September 2025, Blyncsy (a Bentley company) used AI to analyze near real-time imagery for street-level risk assessments. This allowed them to spot issues like areas with standing water or debris-clogged culverts. This type of analysis moves beyond simple "flood zone" classifications to provide property-specific evaluations. Christina Lucas, Global GTM Practice Lead for Insurance at Google Cloud, explained:
"Instead of asking, ‘What zone is this in?’ insurers can use AI models to analyze dozens of resilience factors for each individual property: exact elevation, distance to water, roof age and material, presence of storm shutters, defensible space around structures, local drainage patterns, and building code compliance".
Additionally, gather data on seismic hazards (e.g., soil liquefaction risks), atmospheric risks (e.g., lightning strike density, hail probability), and geological issues like slope stability or landslide susceptibility. APIs like BatchData offer expansive datasets with over 700 data points covering 160+ million U.S. properties, with response times under 100 milliseconds during quoting. Cross-referencing environmental scores with structural details can reveal critical insights – for example, a property in FEMA Zone X with hurricane-impact windows may carry less risk than one in Zone AE with standard glass. Together, these environmental and structural details create a well-rounded risk profile.
Historical Records and Market Data
Tap into endpoints that provide transactional and claims histories to uncover patterns that could signal potential risks. Comparing current property details with historical records can help identify issues like mismatched ownership timelines or undisclosed prior damage, reducing the risk of fraudulent claims.
To stay current, monitor market trends using APIs that track neighborhood appreciation rates, days on market, and comparable sales. These metrics can help adjust replacement cost estimates to reflect local labor and material prices. For large-scale underwriting, BatchData’s bulk data delivery can process multiple properties at once, enabling risk comparisons across entire portfolios. This helps identify outliers that may need manual review. By combining historical trends with current property data, you can build a data-driven underwriting strategy that minimizes risk and maximizes accuracy.
Step 4: Build Risk Models and Scoring Systems
Once you’ve gathered the necessary data points, it’s time to create a detailed risk model. This involves combining structural, environmental, and historical data into a single risk score. This score plays a critical role in underwriting decisions – helping determine whether to approve a policy, adjust premiums, or decline coverage altogether.
Combine Data Points to Calculate Risk Scores
To build accurate risk scores, categorize the API data into four key areas: structural, environmental, financial, and condition. Here’s how each category contributes:
- Structural data: Assesses replacement costs and vulnerabilities.
- Environmental data: Highlights exposure to natural hazards like floods or wildfires.
- Financial data: Flags potential stress or fraud risks.
- Condition data: Reflects the quality of maintenance and the overall state of the property.
Each category should be weighted based on underwriting priorities. For instance, if you’re dealing with properties in disaster-prone areas, environmental risks might carry more weight, while recently renovated properties could see reduced emphasis on condition risks. By leveraging bulk data and historical claims, machine learning models can be trained to refine these weights. Deploying low-latency REST APIs ensures real-time risk scoring capabilities.
Fraud detection can be enhanced by cross-referencing owner data with historical records. Automated alerts can also be set to monitor changes, such as new liens or ownership updates, ensuring risk scores stay current as fresh data becomes available.
Once calculated, these consolidated risk scores should seamlessly integrate into the underwriting workflow, providing actionable insights to guide decisions.
Apply Risk Scores to Underwriting Decisions
Use a 0–100 risk scale to establish clear decision thresholds. For example:
- Low scores: Qualify for standard coverage.
- Moderate scores: Require additional review.
- High scores: May lead to stricter measures or denial of coverage.
These thresholds should be validated through backtesting with historical claims data spanning decades. This ensures that the scoring system aligns with real-world outcomes.
Predictive risk scores help identify high-risk properties early, allowing insurers to focus inspections more effectively and improve loss ratios. By using granular risk data, insurers can also fine-tune pricing, leading to premium growth. Moving away from generalized, zone-based decisions, property-level analysis provides deeper insights. For instance, even within high-risk geographic zones, this approach can uncover insurable properties with lower-than-expected risks.
Integrating these risk scores into underwriting platforms automates pricing decisions with confidence. This ensures that premiums accurately reflect the actual risk of each property, helping carriers avoid losses while maintaining competitive pricing. Ultimately, the success of an insurance business depends on the precision of its risk models, and leveraging detailed property data is key to achieving that accuracy.
Step 5: Automate and Scale Underwriting Operations
Once you’ve developed your risk models, the next hurdle is scaling your underwriting process. Handling hundreds or even thousands of properties manually just isn’t practical. By automating underwriting with detailed risk scores, you can efficiently manage large property portfolios. This shift from manual to automated processes builds on the risk models you’ve already created.
Process Multiple Properties with Bulk Data
BatchData’s bulk data delivery makes it possible to process multiple property identifiers – like addresses or parcel IDs – simultaneously through an API. Instead of looking up properties one at a time, you can evaluate 1,000 properties in a single API call. For instance, if you’re underwriting a 500-property rental portfolio, you can upload all the addresses to BatchData’s bulk endpoint and get back standardized data on factors like roof age, seismic risks, and claim history. Automation can then calculate aggregate risk scores, such as identifying that 15% of the properties face elevated flood risk, cutting down manual review time by 70%.
The process is straightforward: authenticate your API access, prepare a JSON batch request, and submit it via POST for parallel processing. Once you receive the results, you can integrate the data into your CRM or underwriting software to automate scoring. This method not only increases your daily processing capacity from 100 to 10,000 properties but also reduces manual errors from 5% to less than 1%. BatchData also offers delivery through multiple channels to meet the needs of larger operations. After setting up bulk processing, it’s crucial to keep an eye on API performance.
Monitor API Performance and Improve Models
Monitoring API performance is essential to ensure smooth operations. Key metrics to track include uptime (aim for 99.9%), response times (under 5 seconds per batch), error rates (below 0.1%), data freshness (updated within 24 hours), and throughput (e.g., 10,000 properties per hour). Tools like Datadog or Prometheus can help you track latency, failure rates, and other performance indicators in real time. Set alerts for critical thresholds, such as error rates exceeding 2%, and run daily health checks to log performance data.
Beyond monitoring, it’s vital to refine your underwriting models based on actual outcomes. Conduct quarterly reviews to compare API data accuracy against real claims data. For example, if you find that 10% of flood predictions are false positives, adjust your model weights accordingly. Use A/B testing with new bulk data to evaluate different model versions, and implement feedback loops to fine-tune your models. BatchData’s smart portfolio monitoring feature can also provide real-time alerts for critical events, such as new liens, defaults, or ownership changes, helping you stay ahead of evolving risk profiles. By continuously optimizing, you can ensure your models stay accurate and relevant as market conditions and property data change over time.
Conclusion
Throughout this guide, we’ve looked at how API integration and risk modeling are reshaping underwriting, turning outdated, manual processes into streamlined, data-powered systems.
By integrating BatchData, insurers gain access to a rich pool of U.S. property data – details like roof age, construction materials, flood zone proximity, and ownership history are all at their fingertips. This eliminates the need for time-consuming manual research, replacing it with automated workflows that deliver results in seconds instead of hours.
The impact of this approach is clear. Insurers leveraging property data APIs have reported a 40% reduction in underwriting cycle times and a 25% boost in the accuracy of risk predictions. BatchData’s database, updated daily, ensures decisions are based on the latest information, avoiding reliance on outdated quarterly updates. With the ability to query large datasets through a single API call, you’re not just increasing efficiency – you’re making smarter, more informed decisions.
But this shift isn’t just about working faster or more accurately. It’s about scalability and taking a proactive stance on risk management. For example, BatchData’s portfolio monitoring features can alert insurers to key events, like new liens or ownership changes, enabling them to act before risks escalate. With 72% of insurers planning to adopt API-driven data solutions by 2025, those who embrace these tools now will have a head start, gaining an edge in pricing precision and portfolio management.
Ready to see the difference? Start with an API trial to test risk scoring on your target properties. Track metrics like processing speed and approval rates to fine-tune your operations. Whether you’re handling 100 properties or scaling up to 100,000, combining robust data, automated workflows, and real-time insights sets you up for long-term success in the evolving insurance industry.
FAQs
Which property data points most impact underwriting risk?
Property underwriting hinges on a few critical data points that can greatly influence risk assessment. These include the condition of the property, which highlights any existing wear or structural issues, location-specific risks such as susceptibility to floods or wildfires, and historical records detailing prior damages or insurance claims. Together, these elements provide insurers with the insights needed to gauge risk levels and make well-informed underwriting decisions.
How do I validate API property data before using it for pricing?
When working with API property data for pricing, it’s crucial to ensure the data is accurate and reliable. Here’s how you can do it effectively:
- Check for completeness: Make sure all essential details are present, such as property addresses, square footage, and ownership records.
- Cross-verify with trusted sources: Use reliable databases like county records or MLS (Multiple Listing Service) to confirm the accuracy of the data.
- Clean the data: Eliminate duplicates, standardize formats, and correct any errors to avoid inconsistencies.
Using automation tools like APIs and address standardization systems can help streamline these tasks. These tools minimize manual errors, saving time and ensuring that your pricing decisions are based on precise and well-organized data.
What’s the best way to handle API limits in high-volume quoting?
Managing API limits during periods of high activity requires a thoughtful approach to avoid disruptions. Here are some practical strategies:
- Throttling: Control the rate of requests to stay within your API’s quota and prevent overloading the system. This ensures smooth operation and avoids penalties for exceeding limits.
- Batching Requests: Instead of sending individual requests, group them together. This approach makes communication with the API more efficient and reduces the overall number of calls.
- Monitoring Usage: Keep a close eye on your API usage to identify patterns and adjust your strategies as needed. Regular monitoring helps you stay on track with your API plan.
- Automated Retries with Backoff: For temporary rate limit errors, implement automated retries with a backoff strategy. This means waiting progressively longer between retry attempts, which can help resolve issues without overwhelming the API.
Using these methods can help you stick to your API plan and maintain a steady workflow, even during peak usage.