
Most exit processes slow down for one simple reason: sellers send deals to too many wrong buyers. I’d sum up the fix like this: build a clean property record, filter out non-fits, score buyers by what they’ve done instead of what they say, and call the ones most likely to close now.
Here’s the short version:
- I start with the asset facts: market, asset type, size, NOI, occupancy, capex, price, deal structure, and close date.
- I split buyer checks into hard filters and ranking factors.
- I compare declared criteria with observed behavior from past deals.
- I move recent buyers, cash buyers, and 1031-driven buyers to the top.
- I verify contact data before outreach so time isn’t wasted on dead records.
- I track response rate, IOIs, bid conversion, time to PSA, and closing rate to see what is working.
A few numbers stand out. Firms using updated investor data finished acquisition cycles 20% to 40% faster. About 40% of investor sales were investor-to-investor trades. And roughly 69% of investor buyers paid cash as of Q2 2024. To me, that makes one point clear: the best buyer list is not the biggest list; it’s the list built around fit, timing, and ability to close.
What this article gets right is its focus on process. It shows that buyer sourcing is less about mass outreach and more about matching. I’d treat the property like a set of rules, then rank buyers by recent activity, market overlap, deal size, hold pattern, and cash-close history. That approach can cut wasted calls, improve bid quality, and shorten time on market.
If I were applying this in practice, I’d keep the playbook simple:
- Filter first: remove buyers outside the asset class, market, or price range.
- Score second: rank the remaining buyers by transaction history, recency, and portfolio fit.
- Prioritize timing: recent dispositions, 1031 windows, and active buying should move buyers up the list.
- Verify before outreach: confirm phone, email, and compliance status.
- Measure outcomes: if a segment does not produce bids or closes, lower its priority on the next deal.
The core idea is simple: better buyer matching beats broad outreach. When I use current investor profile data well, I spend less time chasing weak leads and more time talking to buyers who can act.
Build a Standardized Property Record Before You Search for Buyers
Start with a clean property record before you build a buyer list. Include asset class, market, size, vintage, NOI, occupancy, rent roll stability and lease rollover, tenant concentration, capex needs, debt pressure, target price, sale structure, and closing timeline. Those details become the filters that trim down the buyer pool.
Separate Hard Filters from Ranking Factors
Each property field should do one of two jobs: filter buyers out or help sort the ones that still fit.
Hard filters are simple yes-or-no checks. If a buyer only acquires the wrong asset class or operates in the wrong region, they shouldn’t be on the outreach list. If their stated deal-size range is below the offering price, the portfolio isn’t a match.
Ranking factors come next. After you remove the obvious non-fits, use details like renovation tolerance, hold period alignment, recent submarket activity, and cash-close history to sort the remaining buyers by how likely they are to close.
The table below shows the split:
| Field Category | Hard filters | Ranking factors |
|---|---|---|
| Geography | Wrong region or submarket | Recent acquisitions in the same submarket |
| Asset Type | Wrong asset class (e.g., office vs. multifamily) | Unit mix or property-type concentration |
| Deal Size | Outside stated range | Average purchase price |
| Condition | Requires renovation beyond buyer’s mandate | History of value-add transactions |
| Timing | No recent acquisitions | Recent purchase volume |
| Financials | Requires seller financing, if unavailable | Percentage of cash-only purchases |
Here’s what that looks like in practice.
Example: Matching Buyers to a Dallas Multifamily Portfolio
Take a hypothetical Dallas multifamily portfolio. The hard filters would include multifamily experience, the right geography, enough capital capacity, willingness to take on the property’s capex burden, and a close date that matches the seller’s timeline.
After that, ranking factors do the sorting. Buyers with documented acquisition activity in the same submarket should move up the list ahead of buyers with only broad market exposure. Investors who completed value-add multifamily deals in the last 36 months should rank above buyers whose recent deals don’t match that profile. And buyers with a high cash-close rate deserve extra weight because they face less financing risk.
Roughly 69% of investor buyers paid in cash as of Q2 2024. That makes cash-close history more than a nice-to-have. It helps you tell the difference between a buyer who looks good on paper and one who can get to the finish line.
Once the asset file is clean, the next step is scoring the buyers against it.
sbb-itb-8058745
Segment and Score Investors Based on What They Have Actually Done, Not Just What They Say
Investor profile data works best when it separates stated criteria from observed behavior. Once the property has narrowed the field, that profile data helps rank the buyers still worth pursuing.
Build Two Profile Layers: Declared Criteria and Observed Behavior
The fastest way to score buyers is to compare what they say they want with what they’ve done in the market. Each investor profile should include two separate layers.
The first is declared criteria. This is what the investor has shared through marketing materials, mandate language, or direct broker conversations.
The second is observed behavior. This is what they’ve actually bought and sold, based on recorded transactions, portfolio growth patterns, and recent activity in the same submarket.
Think of the buy box as the buyer’s real pattern across geography, price, asset type, and unit mix. When both layers line up, confidence in that buyer goes up. When they don’t, that buyer should start lower on the list.
Use a Weighted Buyer Score to Rank Likely Acquirers
Once both profile layers are in place, a weighted scoring model turns that comparison into a ranked buyer list. The strongest inputs show a buyer’s portfolio signature: the properties they own now, average purchase price, average year built, and property type distribution.
| Scoring Field | Use in Scoring | Time-Sensitive Sale | Portfolio-Scale Deal |
|---|---|---|---|
| Buy-box / portfolio fit | Geography, price range, asset class, and property type distribution | High | High |
| Geography fit | Recent acquisitions in the same market or submarket | High | Medium |
| Transaction history | Buy-side and sell-side activity over the last 12, 36, and 60 months | High | High |
| Capital capacity proxies | Cash purchase count and portfolio scale | High | High |
| Acquisition recency | Purchases in the last 12 months | Very High | Medium |
| Contact viability | Reachable phone/email, deliverability, and DNC/TCPA status | High | High |
For a time-sensitive disposition, acquisition recency and capital capacity proxies often deserve the most weight. If a buyer has been active in the last 12 months and has a track record of writing checks, that matters a lot when time is tight.
For a larger portfolio deal, buy-box fit tends to matter more. The buyer has to absorb the asset, make it work inside the rest of the portfolio, and hold it through a full cycle.
Know Which Data Signals Are Reliable and Which Need Verification
Not every data point should carry the same weight. Start by separating hard facts from estimates before scoring.
| Signal Type | Examples | Trust Level |
|---|---|---|
| High-confidence signals | Recorded recent acquisitions, current portfolio size, property type mix, cash purchase history, average purchase price | High |
| Supporting signals | Average hold time, average year built, average living area, strategy tags such as landlord or flipper | Medium |
| Signals requiring verification | Estimated capital availability, public strategy statements, modeled capacity, contact deliverability | Low – validate before acting |
Modeled capital capacity is useful for prioritization, but it is not a substitute for proof of funds. Before outreach, confirm contact reachability, recent activity, and DNC/TCPA status.
Prioritize Buyers by Timing, Readiness, and Ability to Close
After fit and score, timing decides who gets contacted first. A buyer can look perfect for the asset on paper and still miss the closing date. That’s the key point here: fit tells you who could buy, but timing tells you who might move now. Recent dispositions, hold-period maturity, and active capital deployment help separate likely acquirers from buyers who only line up with the profile on paper.
When an investor has recorded a disposition in the last 3 to 6 months, they often move faster because new capital has just been freed up. A recent sale can also point to a 1031 window, which adds urgency. Why? The buyer has to identify and close on a replacement property within set deadlines.
Hold-period maturity is a quieter signal, but it matters. When the current portfolio age starts to line up with an investor’s past average hold period, a sale-and-rebuy cycle is often the next move.
The next step is to rank those matches by who is ready to transact now.
Assign Readiness Tiers Based on Current Acquisition Signals
- Immediate – Verified recent sale, active 1031 window, or heavy 12-month buying
- Near Term – Current hold age nearing the buyer’s norm or recent submarket expansion
- Strategic – Strong buy-box fit, no recent activity
- Stale – No activity in 12 months or bad contact data
Once the tiers are set, turn them into a call list based on urgency.
Turn Timing Signals into Outreach Priority Rules
Use these timing signals to decide who gets the first call.
| Signal | Priority | Verify | Response Speed |
|---|---|---|---|
| Disposition < 45 days | Critical | Recent disposition date; 1031 timing window | Very fast |
| High 12-month purchase volume | High | Active mandate; contact reachability | Fast |
| Hold period nearing average | Medium | Current portfolio age vs. average hold time | Moderate |
| Submarket expansion | Medium | New ZIP or market cluster activity; available capital | Moderate |
| No activity > 12 months | Low | Updated contact info; recent purchase count | Slow or none |
At this stage, contact reachability acts like a gatekeeper. Before you spend time on high-priority outreach, check that phone numbers have a recent reachability flag and that email addresses are marked deliverable.
Cash-heavy buyers are also easier to close because they face fewer financing delays. That makes cash-close history a strong sign of execution speed.
Build a Disposition Workflow Around Investor Data and Track What Works
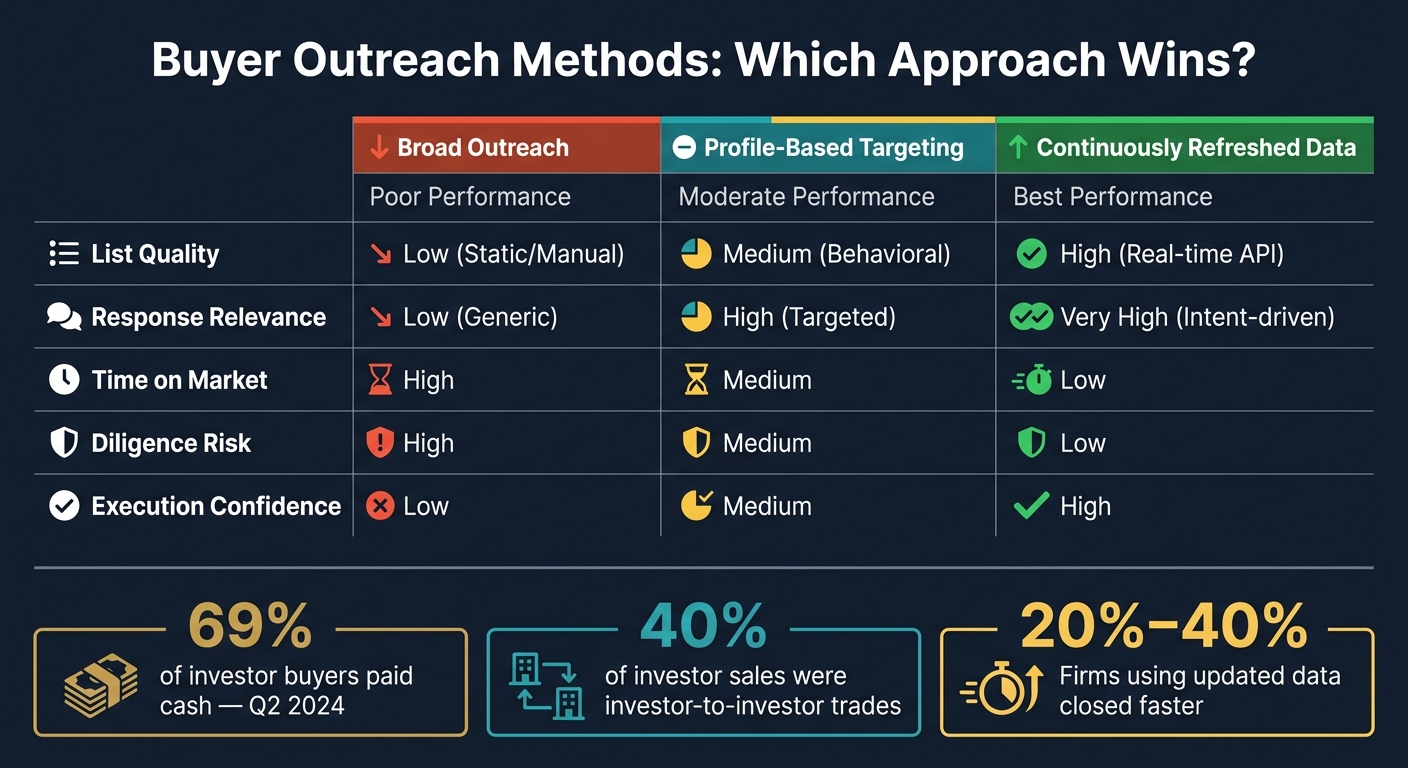
Profile-Based vs. Broad Outreach: Institutional Buyer Targeting Methods Compared
Once buyers are grouped by timing and fit, the next move is to put that list to work. In practice, that means running the same process on every deal so your team isn’t reinventing the wheel each time.
Start by enriching the property record with actionable data. Then match the deal to investor profiles, remove the obvious non-fits, score the buyers who look most likely to act, check whether the contact info still works and whether there are signs they’re still buying, and log what happened after outreach. After each transaction or mandate change, update the record right away instead of waiting for a set calendar date.
How BatchData Supports Enrichment, Verification, and List Maintenance
BatchData supports property enrichment, buy-box matching, contact verification, and bulk or API-based data delivery, so buyer lists stay current across systems. That matters because stale records can quietly drag down a whole process.
Once the workflow is running, watch which tiers convert and which signals line up with closed deals. That’s where the list starts turning from a static database into something you can learn from.
The Metrics That Show Whether Your Targeting Is Working
These metrics help you tell the difference between better targeting and just more motion.
| Metric Category | Core KPIs to Track |
|---|---|
| Funnel Efficiency | Qualified buyers per asset, pass rate on hard filters, contact verification rate |
| Engagement | Response rate by segment, indications of interest (IOI), bid conversion rate |
| Velocity | Time from outreach to IOI, time to signed PSA, time on market |
| Outcome Quality | Closing rate, diligence fallout rate, final price versus guidance, data refresh lag |
Conclusion: Why Profile-Based Targeting Outperforms Broad Outreach
Profile-based targeting beats broad outreach because it blends fit, readiness, and verified contact data into a list that’s more likely to produce bids, faster closes, and fewer dead ends. It’s the difference between sending a deal to everyone and sending it to people who are actually in a position to move.
| Outreach Method | List Quality | Response Relevance | Time on Market | Diligence Risk | Execution Confidence |
|---|---|---|---|---|---|
| Broad Outreach | Low (Static/Manual) | Low (Generic) | High | High | Low |
| Profile-Based | Medium (Behavioral) | High (Targeted) | Medium | Medium | Medium |
| Continuously Refreshed | High (Real-time API) | Very High (Intent-driven) | Low | Low | High |
Firms using advanced, frequently updated datasets have built deal sourcing pipelines that are 30%–50% larger and closed acquisition cycles 20%–40% faster than those relying on legacy data.
FAQs
How do you build a buyer score?
Use a transparent, rule-based ranking system tied to your investment thesis instead of a black-box model. Start with investors who already own, or have recently bought, similar properties. Then rank them using clear signals like portfolio size, purchase activity, cash-buying history, and average hold time.
Put the highest priority on buyers whose past behavior lines up with the asset profile. Fields like total properties owned, purchases in the last 12 months, and property type mix help you zero in on the best-fit buyers first and keep outreach focused where it’s most likely to pay off.
Which buyer signals matter most?
Focus on the signals that show an investor’s buy box and what they actually buy.
Look closely at:
- Recent acquisition volume, with extra attention on the last 12 months
- Transaction patterns, such as average purchase price, property type mix, and hold period
- Similar assets already owned, based on geography, size, and year built
You’ll also want to confirm capital capacity by reviewing cash purchase history.
And contact data has to be usable, not just present. Check that it’s reachable and review compliance flags like DNC or TCPA status.
How often should investor data be updated?
Refresh investor data based on how often each field changes.
Fast-moving fields like listing status, pricing, and valuation should update in real time, or as close to real time as possible. These numbers can shift fast, and stale data can throw off outreach or pricing decisions.
Ownership and contact data usually work well on a weekly refresh cycle. Tax records and assessment history can often be updated daily or weekly, depending on the source and how often it changes.
For disposition work, don’t restart searches from scratch every time. Instead, track change events so you can spot what changed and act on it without wasting time.