GIS transforms real estate market research by turning location data into actionable insights. It combines zoning, demographics, property values, and risk factors into layered maps, helping professionals make smarter decisions faster.
Key Takeaways:
- What is GIS? A tool that organizes and visualizes spatial data for real estate analysis.
- Why use GIS? It simplifies tasks like site selection, risk assessment, and market trend detection by integrating multiple datasets.
- How it works: GIS layers data like zoning, flood zones, and demographics to analyze properties with precision.
- Real-world impact: Investors using GIS have reduced property review times by 40% and increased successful acquisitions by over 30%.
GIS is a must-have for real estate professionals aiming to identify opportunities, assess risks, and streamline decision-making. Here’s how it works and why it matters.
Core GIS Concepts and Data Foundations
Key GIS Concepts for Real Estate Analysis
In real estate market research, GIS (Geographic Information Systems) organizes spatial data into layers, each representing a specific theme like parcels, zoning, or demographics. Within these layers, every individual object is called a feature (e.g., a single property parcel), and each feature includes attributes – detailed information such as owner name, assessed value, year built, or land use code.
Two main data models form the backbone of GIS layers:
- Vector data: Made up of points, lines, and polygons, it’s ideal for representing parcels, streets, and zoning boundaries.
- Raster data: Composed of grids, it’s used for surfaces like flood risks, elevation, or heat maps.
For most real estate workflows in the U.S., vector data is the go-to format, while raster layers add critical context for analyzing risks or environmental factors.
GIS becomes powerful when you use its layers interactively through spatial operations. For example:
- Buffering: Creates zones around a feature, such as a 0.5-mile radius around a subway stop, to identify properties within walking distance that might have higher rental value.
- Proximity analysis: Scores properties based on their distance to schools, highways, or employment hubs.
- Spatial joins: Attach data like census tract income levels directly to individual parcels, enriching property records with neighborhood context.
- Overlay analysis: Combines multiple layers – like zoning, floodplains, and tax incentive zones – to pinpoint sites that meet multiple criteria.
These tools allow for highly specific queries, such as: "Find multifamily-zoned parcels within a 10-minute drive of a major employment center that are outside the 100-year floodplain."
"GIS data layers let you combine location with business context, so teams can stop guessing at property conditions and start screening assets with much tighter logic." – BatchData
Mastering these concepts sets the stage for understanding the data sources that fuel GIS analysis in real estate.
Data Sources for GIS in Real Estate
GIS data for U.S. real estate comes from a mix of federal, state, local, and commercial providers. Some of the most widely used sources include:
- TIGER/Line Shapefiles from the U.S. Census Bureau: These provide nationwide coverage of roads, census tracts, and block groups, forming a foundation for demographic mapping.
- American Community Survey (ACS): Offers five-year estimates with over 40 socioeconomic variables, such as median household income, commute patterns, and education levels, down to the block group level.
- County assessor and recorder portals: The primary source for parcel-level details, including assessed values, land use codes, and transaction histories.
- FEMA‘s National Flood Hazard Layer (NFHL): Essential for mapping flood risks at the parcel level, influencing underwriting and insurance decisions.
- Transportation data: Published by agencies like DOT, providing Average Annual Daily Traffic (AADT) counts and transit routes, which are crucial for retail site selection and transit-oriented development.
| Data Category | Primary U.S. Source | Key Attributes |
|---|---|---|
| Parcels & property records | County assessor / recorder portals | Assessed value, land use, sale price, year built |
| Demographics | U.S. Census Bureau / ACS | Income, population, tenure, education |
| Zoning & land use | City/county planning GIS portals | Zoning code, FAR, height limits, overlays |
| Flood & environmental risk | FEMA NFHL, EPA | Flood zone designation, contamination sites |
| Transportation | DOT, transit agencies (GTFS) | Traffic counts, transit routes, drive-time grids |
| Employment & economy | Bureau of Labor Statistics (BLS) | Employment, wages, unemployment by metro/county |
How Data Enrichment Improves GIS Workflows
While public records provide a solid starting point, they often lack critical details or are outdated, making tasks like geocoding and spatial joins more challenging. Data enrichment fills these gaps by adding verified attributes to property records, such as:
- Owner contact details
- Portfolio size
- Estimated equity
- Absentee ownership flags
- Lien status
- Holding length
Enriched data takes GIS analysis to the next level. For instance, a parcel layer with absentee owner flags and equity estimates allows you to filter properties not just by location and zoning but also by seller motivation. This can narrow a list of 10,000 parcels down to a few hundred high-priority targets. For off-market deals, enriched data connects you directly to decision-makers, enabling more effective outreach.
BatchData is a leading provider in this space, offering bulk property and contact data enrichment, skip tracing, phone verification, and real-time property search APIs. In February 2026, real estate investors using BatchData’s API analyzed 20–30 markets per month and generated 500–1,000 qualified leads – far surpassing the 2–3 markets and 50–100 leads achieved with traditional methods.
Step-by-Step GIS Workflow for Spotting Market Opportunities
Define Your Investment Goals and Criteria
Before diving into any GIS tool, it’s critical to establish a clear, measurable investment plan. This means outlining your target asset type – whether it’s Class B multifamily units, single-family rentals, or neighborhood retail spaces. Next, pinpoint your geographic focus, which could range from specific MSAs or ZIP codes to custom areas like "within a 30-minute drive of downtown Dallas, TX." Finally, define your financial parameters in concrete terms, such as acquisition price ranges (e.g., $1,500,000–$3,000,000), price per square foot (e.g., under $200/sq ft), and minimum lot sizes (e.g., 6,000–10,000 sq ft).
Don’t forget to factor in risk constraints. For example, you might want to exclude flood zones, limit crime index values, or require a minimum school quality score. These constraints can translate directly into spatial filters. A clear example might be: "median household income > $70,000, population growth > 1.5% annually over five years, and within 0.5 miles of a grocery store." The more precise and numeric your criteria, the faster and more effective your GIS analysis will be.
Gather, Clean, and Geocode Property Data
Once your goals are defined, the next step is to compile a property-level dataset that can be mapped accurately. Your dataset should include key fields such as the full street address (city, state, ZIP), county parcel ID (APN), lot size, building area, year built, zoning code, last sale date and price, assessed value, and owner information.
Start by sourcing this data from county assessor portals and open GIS data platforms. Enhance it with transactional and listing data to include recent sale prices or rent comparisons. After gathering the data, clean it thoroughly – standardize address formats to USPS guidelines, remove duplicates, and ensure numeric fields like lot size and price fall within realistic local ranges. Missing values for critical fields like year built or building area should be flagged or filled in where possible.
The next crucial step is geocoding, where street addresses are converted into latitude and longitude coordinates. Aim for rooftop-level accuracy, not just ZIP code centroids. After geocoding, verify match scores to ensure precision. If parcel shapefiles are available, matching records by APN to parcel polygons and deriving centroids can yield even better results. Tools like BatchData can simplify this process by providing standardized addresses and enriched property data, speeding up your workflow.
Build and Analyze GIS Layers
Once your geocoded data is ready, it’s time to start the layered analysis. Load your data into a GIS platform and overlay it with thematic layers. Here are five key layer types to consider:
| Layer Type | Key Attributes | Primary Use |
|---|---|---|
| Demographics | Median household income, population growth, renter vs. owner ratio | Locate high-demand or growing neighborhoods |
| Housing & pricing | Median home values, rent levels, vacancy rates, appreciation trends | Spot undervalued or high-growth areas |
| Accessibility | Drive-time isochrones, transit stops, proximity to employers | Evaluate location quality |
| Zoning & land use | Zoning codes, FAR, overlay districts, future land-use plans | Identify redevelopment or density opportunities |
| Risk & environment | FEMA floodplains, wildfire zones, crime density, contamination sites | Flag or exclude high-risk areas |
Use density heat maps to identify clusters of high rents or frequent transactions. These often highlight "spillover" areas where property values are rising near pricier neighborhoods. Drive-time polygons are particularly useful for defining realistic catchment areas, especially for retail or transit-oriented properties. To refine your analysis, create a composite site suitability score by assigning weights to your criteria (e.g., 30% income growth, 25% rent levels, 20% transit proximity, etc.) and rank properties based on these scores.
Filter Results and Build a Target Property List
After scoring properties, apply your spatial and attribute filters to narrow down the list to the most promising opportunities. For example, a real estate firm used BatchData’s platform in January 2026 to screen single-family homes in Phoenix, AZ, priced between $300,000 and $500,000. Out of over 155 million records, they identified 157 properties that met their criteria, leading to a 34% increase in successful acquisitions compared to the previous quarter.
Once you have your shortlist, focus on data enrichment to turn your map results into actionable leads. This involves adding owner contact information to prioritize outreach. Tools like BatchData make this step easier with bulk contact enrichment, skip tracing, and phone verification, enabling direct outreach to property owners from your GIS-filtered list.
GIS FOR REAL ESTATE PROFESSIONALS
sbb-itb-8058745
Practical GIS Use Cases in Real Estate Market Research
Building on essential GIS workflows, these examples highlight how GIS can turn real estate market research into actionable strategies.
Market Segmentation and Customer Profiling
GIS goes beyond simply mapping properties – it unveils the characteristics of buyers, renters, and residents, as well as the factors influencing their decisions. By layering data like Census demographics, mobility patterns, and points of interest (POI) over property parcels, analysts can create detailed community profiles that surpass the limitations of broad ZIP code-based insights.
Take Taylor Morrison, for instance. In January 2026, senior analyst Stephanie Soulé used GIS demographic analysis to shape architectural choices. In areas where data revealed that 15% or more of customers had children, she recommended prioritizing three-bedroom floor plans over two-bedroom homes with tandem garages. This adjustment aligned better with actual buyer preferences. The same team also geocoded buyer addresses to identify preferred highway corridors, reallocating signage to boost conversions across multiple markets.
"With this data, we can make decisions in real time now instead of waiting and losing margins or not getting as many buyers." – Stephanie Soulé, Senior Market Intelligence and Strategy Analyst, Taylor Morrison
Streamlined and enriched data makes segmentation faster and more precise. Tools like BatchData enhance this process by providing enriched property and contact data that seamlessly integrates into GIS workflows, helping analysts quickly move from raw addresses to actionable buyer insights.
These customer profiles naturally feed into more strategic decisions, such as optimizing site selection and defining targeted trade areas.
Site Selection and Trade Area Analysis
When it comes to retail, multifamily, or mixed-use developments, location is just as important as design. GIS-enabled site selection leverages data layering techniques to replace intuition-based decisions with a systematic, data-driven approach. By incorporating tools like drive-time isochrones, foot traffic data, and competitor mapping, analysts can define trade areas more accurately.
A major shift in GIS site selection is the move away from simple radius-based methods, which fail to account for real-world obstacles like rivers, highways, or one-way streets. Instead, drive-time isochrones reflect how customers actually navigate their surroundings. Research shows that 93% of consumers travel no more than 20 minutes for everyday purchases, and primary trade areas typically account for 55% to 70% of a location’s total customer base. Techniques like whitespace analysis (finding underserved areas within a metro) and cannibalization analysis (avoiding revenue overlap) are vital for portfolio-level decisions. Retailers who use spatial analytics for network optimization have uncovered revenue opportunities equal to up to 20% of their existing base. Additionally, the location-intelligence market is expected to grow significantly, from $21.21 billion in 2024 to a projected 16.8% annual growth rate through 2030.
Risk Assessment and Portfolio Optimization
GIS is an essential tool for evaluating risk before making investment decisions. By overlaying FEMA flood maps, wildfire risk indices, zoning data, and utility infrastructure maps onto potential properties, underwriting teams can screen hundreds of assets in minutes instead of days.
The financial stakes are high. A single failed retail location can result in losses ranging from $500,000 to $2 million due to buildout expenses, lease obligations, and lost opportunities. GIS-based workflows significantly speed up risk assessments compared to relying on broker reports alone. Beyond initial hazard screening, portfolio teams can use spatial data to monitor existing assets as conditions evolve – for example, when a new transit line opens nearby or when demographic shifts impact a specific submarket.
Measuring Results and Scaling GIS in Market Research
GIS-Enhanced vs. Standard Real Estate Market Research
Metrics for Tracking GIS-Driven Decisions
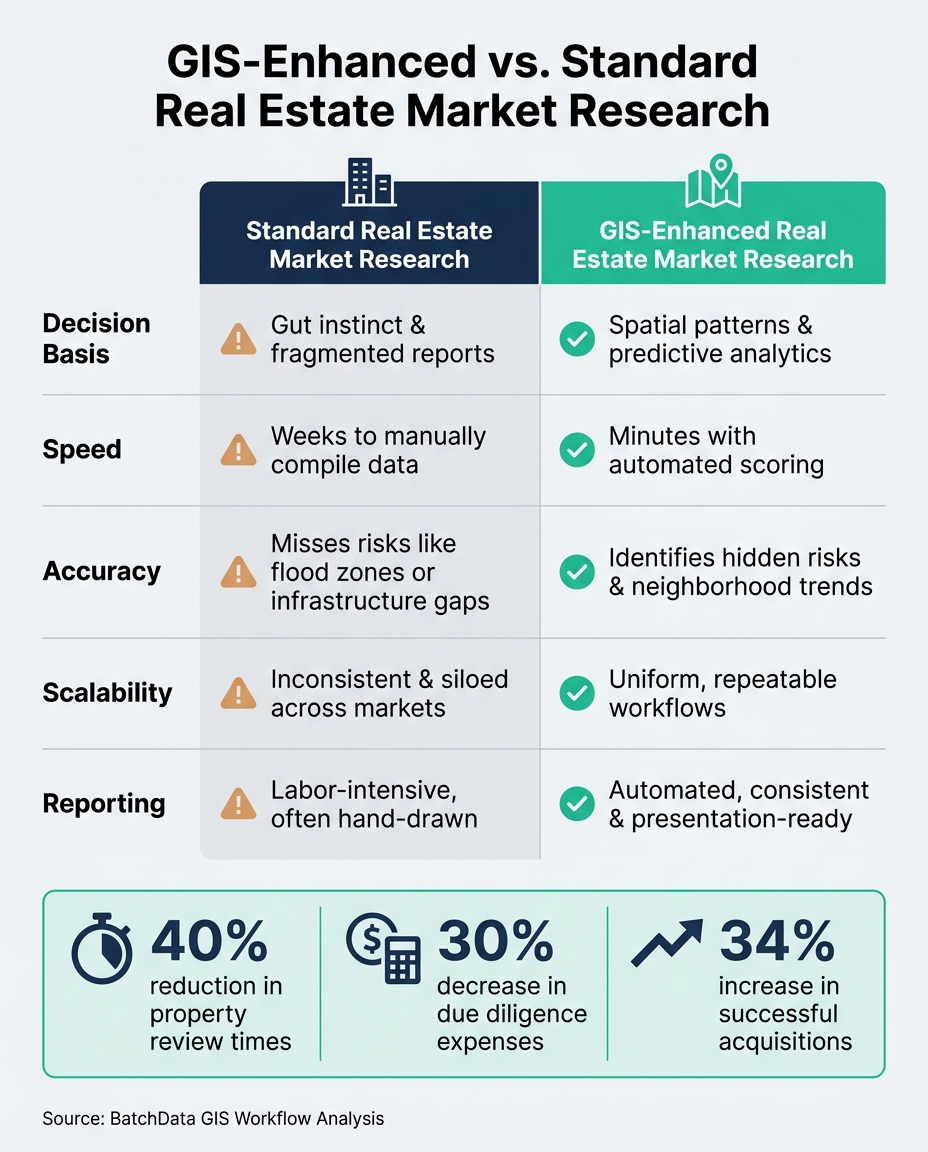
The return on investment (ROI) for GIS can be broken down into three main areas: financial, operational, and strategic. Financially, one of the clearest benefits is the "avoided cost" metric – just one flagged high-risk deal can often cover the cost of the platform for an entire year. Operationally, metrics like time-to-decision and the number of reviews per analyst are key indicators. For example, implementing a GIS workflow can cut property review times by 40% and reduce due diligence expenses by 30% within six months. On the strategic side, teams should track how many new acquisitions meet internal benchmarks, such as "growth corridor" goals. These numbers typically improve when data-driven scoring replaces subjective decision-making. Together, these metrics highlight how GIS can streamline decision-making with reliable and repeatable workflows.
"GIS maturity is measured by how effectively layers inform property decisions – approving, rejecting, routing, contacting, or pricing an asset." – BatchData
Building Repeatable GIS Workflows
Once the benefits of GIS in ROI and efficiency are clear, the next step is to scale these advantages by creating standardized workflows. This is what separates a one-off map from a fully integrated GIS operation. Treating GIS as a decision-making system rather than just a visualization tool is key. Spatial data layers can feed into scoring models, eligibility rules, and automated triggers to make the process seamless.
A good starting point is to develop tiered data products. This means keeping raw, detailed layers for analysts while providing simplified, user-friendly versions for brokers or acquisition teams. This approach ensures high-speed decision-making without overwhelming users. For instance, Colliers Utah automated map generation for brokers, cutting production time by 75% and achieving full team adoption.
"We need maps that are informative and present accurate data. But we also need them to be aesthetically pleasing, something that can be inserted into a flyer or incorporated into a pitch presentation." – Kate Wright, GIS Analyst, Colliers Utah
When integrating GIS into broader systems, the delivery model should match the specific use case. APIs are ideal for real-time decisions, like checking flood zones or zoning during initial screenings. Bulk data files work better for historical analysis and portfolio updates, while data warehouse solutions (such as Snowflake or BigQuery) are suited for SQL-heavy teams that need a centralized source of truth. Platforms like BatchData enable enriched property data to flow directly into existing GIS workflows, eliminating the need for a complete system overhaul. This kind of integration can improve reporting consistency by up to 50% when teams move from manual processes to automated GIS templates.
GIS-Enhanced vs. Standard Market Research: A Comparison
Standardized GIS workflows bring a whole new level of efficiency and accuracy compared to traditional market research methods. Here’s a side-by-side look at how GIS-driven research stacks up:
| Feature | Standard Research | GIS-Enhanced Research |
|---|---|---|
| Decision Basis | Relies on gut instinct and fragmented reports | Uses spatial patterns and predictive analytics |
| Speed | Takes weeks to manually compile data | Delivers results in minutes with automated scoring |
| Accuracy | Prone to missing risks like flood zones or infrastructure gaps | Identifies hidden risks and neighborhood trends |
| Scalability | Inconsistent and siloed across markets | Provides uniform, repeatable workflows |
| Reporting | Labor-intensive, often hand-drawn | Automated, consistent, and presentation-ready |
Take RIPCO Real Estate as an example. Faced with inflation-driven pressures, they shifted from hand-drawn maps to a GIS-based system. This allowed them to deliver precise traffic data, detailed demographics, and competitive insights to clients like Chipotle. The change not only sped up decision-making but also strengthened their ability to meet client needs as they expanded across the East Coast and Florida. This operational upgrade proved invaluable in maintaining credibility and delivering results in a competitive market.
Conclusion: Using GIS to Find Better Real Estate Opportunities
GIS isn’t just about creating maps – it’s a powerful decision-making tool that helps real estate professionals zero in on the best opportunities. By shifting its use from simple visualization to a more strategic approach, GIS reduces guesswork and sharpens decision-making.
When you layer in data like demographics, zoning, risk factors, and pricing, GIS turns vague market theories into clear, actionable insights. For example, a multifamily investor could use GIS to identify Class B properties within a 30-minute commute of major employment hubs, located in census tracts with rising median rents and outside high-crime areas. This process creates a prioritized list of opportunities that are ready for action. Retail and restaurant chains using GIS-based trade area analysis have reported sales increases of 5–15% at new locations compared to older site-selection methods.
Another standout advantage is risk management. Adding risk layers to your analysis reveals vulnerabilities that traditional methods might overlook, giving you the chance to mitigate issues early and protect your investment. By identifying risks before closing, GIS proves its worth in safeguarding value.
"The question has shifted from, ‘Is this a good deal?’ to ‘What does the data say about this deal’s risk, potential, and portfolio fit?’" – BatchData
Of course, a map is only as useful as the data behind it. When GIS is paired with enriched property and contact data – like ownership records, verified phone numbers, and parcel-specific details from BatchData – it bridges the gap between identifying opportunities and acting on them. As highlighted earlier, enriched datasets make it possible to generate owner contact lists immediately after pinpointing a promising area. This dramatically cuts down the time between spotting an opportunity on the map and starting conversations. Without GIS, relying on static tables and PDFs can hide profitable patterns that are otherwise easy to see with visualization.
FAQs
What GIS layers should I start with for market research?
When diving into real estate market research, these six GIS layers are essential tools to help you make informed decisions:
- Parcels: These outline property boundaries and include critical legal information, helping you understand the precise limits and ownership of a property.
- Zoning: This layer reveals land use regulations, such as permitted activities and redevelopment possibilities, ensuring you know what’s allowed on a given site.
- Flood and Hazard: Use this to evaluate potential risks, including flood zones or other environmental hazards, which could impact insurance costs or long-term property safety.
- Imagery and Elevation: Aerial imagery and elevation data provide a visual overview of the property and its surroundings, along with terrain details that might influence development plans.
- Utilities and Infrastructure: This layer helps assess the availability of essential services like water, sewer, and power, as well as transportation access, which are crucial for development feasibility.
- Ownership and Attributes: Identify property owners, transaction history, and other key details to better understand a property’s background and potential opportunities.
These layers work together to provide a comprehensive view of the real estate landscape, making them indispensable for thorough market analysis.
How accurate does geocoding need to be for deal screening?
Geocoding accuracy plays a key role in deal screening, especially when rooftop-level precision is required for tasks like underwriting and property valuation. Using less precise methods, such as range interpolation, can result in errors that affect proximity analysis and property assessments. To make sound investment decisions, it’s important to rely on verified, high-precision geocoding that directly maps coordinates to the property, minimizing risks caused by approximations.
What ROI metrics prove GIS is working for my team?
GIS proves its worth when you track metrics like time saved during property reviews and due diligence, reduced operational expenses, and improvements in portfolio performance. Look for indicators such as meeting growth targets, steering clear of high-risk properties (like those in flood zones), and ensuring precise valuations. The end goal? Boosting ROI by enabling your team to pinpoint and invest in better-performing markets while minimizing potential risks.