Understanding demographics is crucial for making smart real estate investments. Factors like population growth, age distribution, and income trends shape housing demand and property value. By analyzing these shifts, you can identify high-growth areas, predict future market needs, and avoid declining markets. Here’s what you need to know:
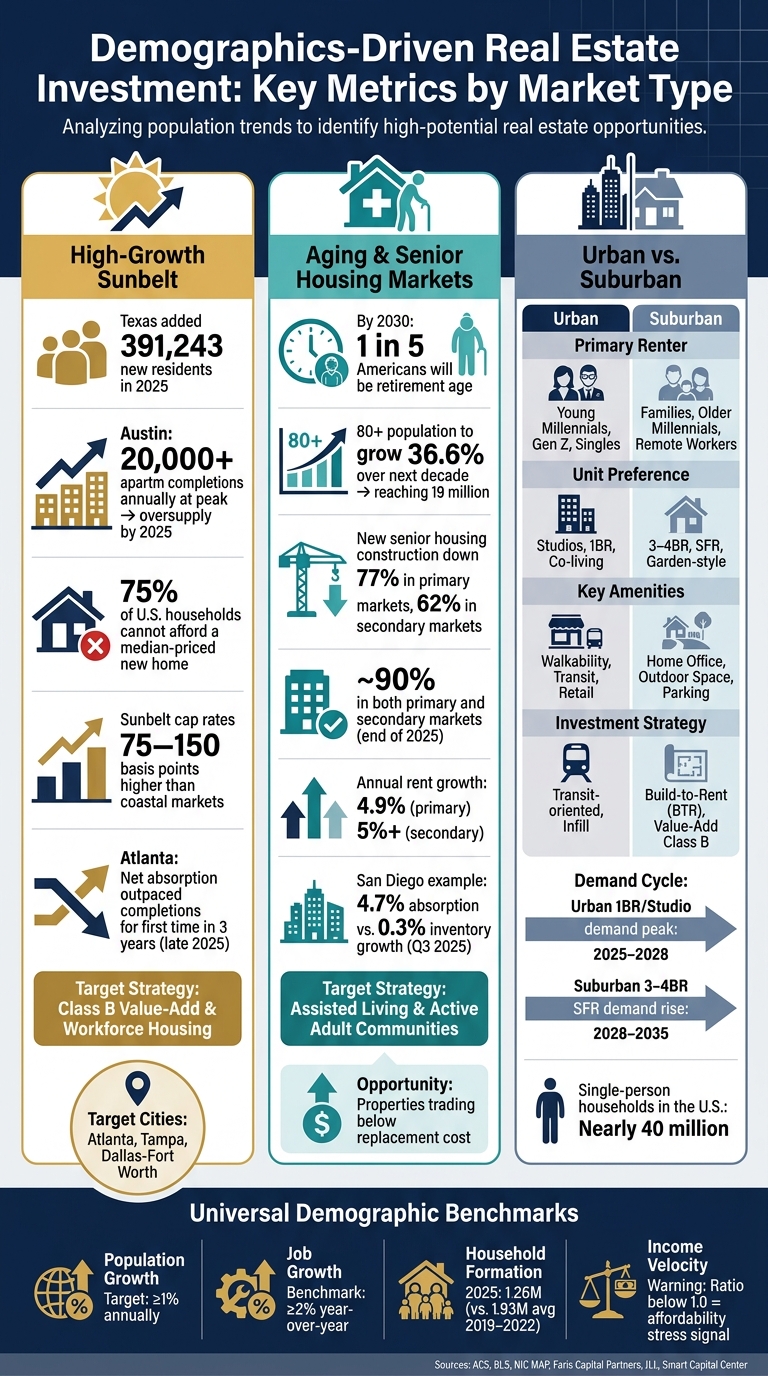
- Population Trends: Growing areas, especially in the South and Sunbelt regions, signal increased housing demand. For example, Texas added over 391,000 residents in 2025.
- Age Groups: Different age cohorts prefer specific property types. Millennials lean toward suburban family homes, while Baby Boomers drive demand for senior housing.
- Income and Employment: Markets with rising incomes and job growth (2%+ annually) are more likely to sustain rent levels and property values.
2025 Housing Market Insights: Buyer Trends, Demographics & Where Your Business Should Focus
sbb-itb-8058745
Key Demographic Factors That Influence Property Decisions
Demographics play a huge role in shaping real estate markets. Factors like population trends, age distribution, and income levels help investors identify opportunities, understand demand, and make informed decisions using a real estate API for property investments. These elements determine where growth happens, which property types thrive, and how long a market might sustain value increases.
Population Growth and Density
Population growth is one of the clearest indicators of housing demand. When the number of people in an area grows faster than the housing supply, prices and rents tend to rise. As a rule of thumb, investors often target markets with at least 1% annual population growth.
But it’s not just about total population numbers. For multifamily properties, the household formation rate is a better metric to track. A market might see an increase in residents while household formation stagnates – often because younger adults delay moving out on their own due to high costs. For example, in early 2025, annual household formation dropped to 1.26 million, a sharp decline compared to the 1.93 million average between 2019 and 2022.
Regional trends also matter. The South stood out in 2025, growing at a rate of 0.9%, far outpacing the Northeast’s sluggish 0.2%. Texas alone welcomed 391,243 new residents that year. On the flip side, areas with stagnant or shrinking populations face risks like higher vacancies, falling rents, and depreciation. In such cases, a quick exit strategy might be worth considering.
Beyond population numbers, the age breakdown of residents provides even deeper insights into market dynamics.
Age Groups and Life Stages
Different age groups have distinct housing preferences, which can guide investment strategies:
| Cohort | Property Preference | Investment Opportunity |
|---|---|---|
| Gen Z / Young Singles | Studios, 1-bedroom units, co-living spaces | Urban multifamily buildings with amenities |
| Millennials (Families) | 3-bedroom or larger units, build-to-rent homes | Suburban developments and mixed-use communities |
| Baby Boomers | Senior housing, active adult communities | Assisted living and wellness-focused properties |
| Single-Person Households | Smaller, efficient units | Urban infill projects and micro-apartments |
Student debt continues to weigh heavily on younger generations, delaying homeownership and extending rental periods during their prime family-forming years. Meanwhile, Baby Boomers are reshaping the market with the so-called "Silver Tsunami." By 2030, one in five Americans will be of retirement age. Yet, despite this growing need, construction of senior housing has dropped by 60% from pre-COVID levels, creating a clear opening for senior-focused developments.
"Senior housing is more than just infrastructure; it fosters social connections among its residents. It also efficiently delivers care, allowing residents to age in place." – Lauren Hochfelder, Managing Director, Morgan Stanley Real Estate Investing
Additionally, the rise of single-person households – nearly 40 million in the U.S. alone – is fueling demand for studios and one-bedroom apartments, even in areas where overall population growth is modest.
Income Levels and Employment
Income and job data round out the demographic picture, offering crucial insights into a market’s ability to sustain rent levels. A key metric here is income velocity, which compares household income growth to rent growth over the past two years. When this ratio drops below 1.0, it signals that rents are rising faster than incomes, creating affordability pressures that can lead to higher vacancies or rent concessions.
"A trade area where income growth is running below rent growth is accumulating affordability stress that will eventually surface as elevated vacancy or downward rent pressure, regardless of current occupancy levels." – Smart Capital Center
Employment growth is another critical factor. A year-over-year job growth rate of at least 2.0% is often used as a benchmark to identify strong markets. Markets falling below this rate may see less reliable property appreciation, making cash flow management even more essential. For industrial and office properties, the size of the workforce aged 18–54 within a 5–15 mile radius becomes crucial. Without a deep labor pool, tenants may struggle to expand, no matter how well-positioned the property. Additionally, markets overly reliant on a single employer or industry carry risks that demographic data alone might not fully capture.
Putting Demographic Data to Work in Property Acquisition
Understanding which demographic factors are important is just the first step. The real advantage comes from creating a repeatable process that transforms data into actionable decisions – starting with choosing the right metro area and narrowing down to specific property owners.
Screening Markets with Demographic Data
Before diving into individual deals, it’s crucial to establish clear, quantitative benchmarks. Start by defining your ideal tenant profile – whether it’s young professionals, families, or retirees – and translate that into measurable criteria like income ranges, age groups, renter percentages, and household formation trends. Then, use data sources like the ACS, BLS, IRS migration files, and USPS data to evaluate metros based on population, income, migration, and employment statistics.
A practical way to assess markets is to score each metro on factors like population growth, income growth, net migration, and employment diversity, using a scale of 1–5. Set a minimum composite score to determine which markets meet your criteria. This approach ensures a consistent, data-driven process and avoids reliance on subjective judgments. Once the metros are ranked, dive deeper to identify standout neighborhoods.
Analyzing Demographics at the Neighborhood Level
Metro-level trends are just the starting point; neighborhood-level data provides the finer details needed to identify the best real estate investing opportunities. Metro averages can sometimes hide the true picture – strong markets often have underperforming areas, while weaker metros can include hidden gems. The goal is to pinpoint demographic over-achievers: neighborhoods where metrics like income growth, renter demand, or a key age group outperform the broader metro area.
To do this, analyze census tract or block group data, focusing on metrics like median household income, renter-to-owner ratios, age distribution, and 5-year population growth. Add in factors like school quality, crime rates, and proximity to employment hubs to create a comprehensive neighborhood profile. GIS mapping tools can help visualize these trends, making it easier to compare neighborhoods within the same metro and turn instincts into data-backed decisions.
For specific properties, define a trade area using drive-time rings (commonly 5, 10, and 15 minutes) and extract demographic data for these zones. For multifamily properties, prioritize metrics like renter share and the 20–44 age group. For senior housing, focus on the density of residents aged 65+ and caregiver demographics (ages 45–64). Retail and mixed-use properties should also consider daytime population – workers and visitors – not just residential statistics.
Using Data Enrichment for Targeted Acquisition
After identifying promising areas and properties, take it a step further with data enrichment. Demographic screening tells you where to focus; data enrichment reveals who to target. This involves enhancing property records – sourced from county assessor files or tax records – with ownership details, financial indicators, and behavioral attributes to identify the owners most likely to sell.
Tools like BatchData (batchdata.io) can help with property and contact data enrichment, skip tracing, phone verification, and bulk data APIs. They can even uncover the individuals behind LLCs and trusts, which is vital for reaching decision-makers directly instead of getting stuck with registered agents. Combining enriched ownership data with demographic insights allows for precise, effective outreach. This ensures every acquisition effort is focused on properties aligned with your demographic strategy and owned by motivated sellers, maximizing the efficiency of your acquisition process.
Matching Property Strategies to Demographic Trends
Demographics-Driven Real Estate: Key Metrics & Investment Strategies by Market Type
Tailoring acquisition strategies to align with demographic shifts is crucial. Each market has its own dynamics, and treating them uniformly can lead to costly errors.
High-Growth Sunbelt Regions
The Sunbelt continues to experience robust population growth, but the patterns vary widely. In 2025, Texas led the nation in population gains, with Florida and North Carolina also seeing strong growth. Domestic migration, driven by corporate relocations and affordability, remains a key factor in these areas.
However, not all Sunbelt submarkets are equally promising. For instance, Austin’s rapid expansion led to over 20,000 apartment completions annually during its peak, creating oversupply pressures by 2025. Instead, focus on supply-constrained areas near new infrastructure, top schools, and major employers – places where demand exceeds new supply. Faris Capital Partners successfully adopted this approach in 2025 and 2026, targeting Class B renovated communities in cities like Atlanta, Tampa, and Dallas-Fort Worth. In Atlanta, net absorption outpaced new completions for the first time in three years by late 2025.
"The question isn’t ‘did the U.S. grow slower?’ The question is ‘did the specific submarket I’m investing in continue to attract residents with incomes and lifestyles that support apartment demand?’" – John Makarewicz, President, Faris Capital Partners
With nearly 75% of U.S. households unable to afford a median-priced new home, workforce housing and Class B value-add apartments stand out as resilient investment options in these high-growth areas. Sunbelt cap rates are 75–150 basis points higher than those in coastal markets, offering stronger yields. However, investors should carefully evaluate rising insurance and tax costs in states like Florida and Texas.
While the Sunbelt thrives on population growth, other regions with aging demographics require a different approach.
Aging Markets and Senior Housing
The senior housing sector is becoming increasingly important. Starting in 2026, the first wave of Baby Boomers will turn 80, a milestone age when demand for senior housing surges. Over the next decade, the U.S. population aged 80 and older is expected to grow by 36.6%, reaching 19 million. Meanwhile, new construction in this sector has slowed significantly – down 77% in primary markets and 62% in secondary markets from recent peaks.
Occupancy rates in senior housing reached nearly 90% in both primary and secondary markets by the end of 2025, with annual asking rent growth for Assisted Living hitting 4.9%. Many properties are trading below replacement cost, creating attractive opportunities. Key indicators for market evaluation include the density of households aged 75+ with annual incomes between $50,000 and $75,000, penetration rates, and whether net absorption consistently exceeds new inventory growth.
"The seniors housing sector is experiencing a powerful convergence of favorable conditions. Strong fundamentals, constrained supply, and unprecedented demographic tailwinds are driving renewed investor interest." – Bryan J. Lockard, Executive Managing Director, JLL Value & Risk Advisory
Secondary markets often outperform in rent growth, with Assisted Living rents in these areas exceeding 5% annually. For example, the San Diego metro reported an annual absorption rate of 4.7% against just 0.3% inventory growth in Q3 2025, along with a penetration rate of 11.2% and a median occupancy of 91.7%.
Urban vs. Suburban Dynamics
Urban and suburban markets offer distinct opportunities shaped by demographic trends. Urban cores attract young millennials, Gen Z renters, single-person households (now numbering nearly 40 million), and aging adults seeking walkable environments. Suburban areas, on the other hand, appeal to older millennials entering family-forming years, remote workers seeking more space, and homeowners reluctant to sell due to low mortgage rates.
| Feature | Urban | Suburban |
|---|---|---|
| Primary Renter | Young millennials, Gen Z, single professionals, active seniors | Families, older millennials, remote workers |
| Unit Preference | Studios, 1BR, co-living, efficient layouts | 3–4 BR, single-family rentals, garden-style |
| Key Amenities | Walkability, transit access, experiential retail | Home offices, outdoor space, pet amenities, parking |
| Investment Strategy | Transit-oriented development, infill, medical office | Build-to-rent (BTR), value-add Class B, lifestyle-oriented |
Demand for urban 1BR and studio apartments is expected to peak between 2025 and 2028. Meanwhile, suburban demand for 3–4 BR single-family rentals is projected to rise between 2028 and 2035. Timing acquisitions to align with these cycles, rather than reacting to current conditions, demonstrates the value of precise, data-driven demographic insights. Whether focusing on Sunbelt growth, senior housing shortages, or urban-suburban demand cycles, aligning strategies with demographic data offers a clear advantage.
Conclusion: Using Demographics to Make Better Investment Decisions
Demographic data transforms investing from a guessing game into a structured, repeatable process. For instance, knowing that Texas, Florida, and Arizona are leading the nation in net domestic migration highlights where rental demand is growing and where it might decline in the years ahead.
The key idea here is that demographics work best as part of a layered approach – not as a standalone data point. Start by analyzing metro-level trends like population growth, net migration, and employment figures. Then, narrow your focus to specific ZIP codes or census tracts where factors like income levels, age groups, and household types align with your target property or investment goals.
Demographics also act as a safeguard for your capital. Markets with stagnant or declining populations, dependence on a single employer, or a shrinking working-age population carry risks that occupancy rates alone might not reveal. To better manage these risks, stress-test rent projections against realistic household income trends.
Taking this a step further, enriched property and contact data can bridge the gap between demographic insights and actionable opportunities. Tools like BatchData link demographic profiles to property records for over 100 million U.S. households. This allows investors to create highly targeted acquisition lists based on specific criteria – such as identifying long-term owners in fast-growing Sunbelt submarkets or senior homeowners in areas with rising 65+ populations. Features like skip tracing, phone verification, and bulk data delivery streamline the process, helping turn market analysis into direct outreach and, ultimately, signed deals.
"A skilled investor evaluates not only the property but also the demographic trends that buoy its value."
Top-performing investors don’t just react to today’s headlines – they prepare for demographic shifts already visible in the data. Whether the opportunity lies in a tight Sunbelt suburb, an underserved senior housing market, or an urban area attracting young professionals, the principle remains the same: align the asset with the people who will live there, and the fundamentals often follow. This is the essence of a data-backed, demographic-driven investment strategy.
FAQs
Which demographic metrics matter most for my property type?
Understanding demographic metrics is crucial, but the focus shifts depending on the type of property and its target audience. Here’s a breakdown:
- Multifamily Properties: Pay attention to household formation rates and income growth. These factors indicate how many people are forming new households and whether they have the financial resources to support renting or buying.
- Retail Properties: Look at the daytime population, median income, and spending patterns. These metrics help gauge potential foot traffic and purchasing power in the area.
- Office Spaces: Concentrate on the density of knowledge workers and education levels. High concentrations of educated professionals often signal a strong market for office spaces.
- Industrial Properties: Focus on the labor pool (ages 18–54) and e-commerce trends. A robust workforce and growth in online shopping can drive demand for industrial facilities.
- Senior Housing: Keep an eye on the growth of the 65+ population and household wealth. These indicators help identify areas with a rising demand for senior living options.
Tailoring your analysis to the property type ensures you’re targeting the right audience with the right data.
How do I spot “demographic over-achiever” neighborhoods in a metro?
To identify neighborhoods that might see future growth, look for key indicators. These include rising household formation rates or areas attracting young professionals with higher incomes. These trends often signal a community on the verge of transformation.
Dig deeper by analyzing factors such as growth in high-paying job sectors, increasing salary levels, and improvements in school ratings. These elements often go hand-in-hand with neighborhood development and increased demand for housing.
Using tools like BatchData can provide a competitive edge. This platform helps connect personal and financial attributes to property records, offering insights into market dynamics. Additionally, monitor metrics like average days on market and shifts in wealth distribution. These data points can help uncover areas with long-term value potential, guiding smarter investment decisions.
How can I use BatchData – Ivo Draginov to target likely sellers in growing areas?
BatchData offers a powerful way to spot potential sellers in booming neighborhoods. It combines sale propensity scoring with detailed demographic and property data. With BatchRank AI, you can identify properties that are up to 26 times more likely to be listed within three months.
Want to refine your search? Filter leads by life events – like moving or divorce – or by demographics such as income or age. You can even dive into neighborhood trends, like price increases or inventory shifts, to zero in on markets with the best growth potential.