SEO Title: County Maps Zip Codes: A Guide to Geographic Data
Meta Description: Learn how to map ZIP codes to counties accurately. This guide covers ZCTAs, TIGER/Line files, spatial joins, and data visualization for real estate analysis.
Meta Keywords: county maps zip codes, zip code to county crosswalk, ZCTA vs ZIP code, TIGER/Line shapefiles, geospatial analysis real estate, geographic boundary data, QGIS spatial join
Mapping **county boundaries using ZIP codes** is a classic real estate data trap built on a flawed premise. ZIP codes were engineered for mail delivery, not for defining the legal lines that dictate property taxes, zoning, and school districts. This fundamental disconnect creates operational friction and leads to critical business decisions based on incorrect geographic data.
The solution requires accurately linking ZIP codes to their corresponding county jurisdictions, a process that moves analysis from guesswork to precision. Without a reliable method to connect these geographies, market analysis is flawed, risk assessments are inaccurate, and investment strategies are compromised.
| Core Takeaway | Description |
| :--- | :--- |
| **Geographic Mismatch** | ZIP codes are logistical routes, not legal boundaries, and frequently cross county lines. |
| **Data Standard** | **ZIP Code Tabulation Areas (ZCTAs)** from the U.S. Census Bureau are the standard for spatial analysis. |
| **Key Technique** | A **spatial join** is used to overlay ZCTA and county maps to create a "crosswalk" file. |
| **Business Impact** | Accurate mapping drives smarter decisions in lending, insurance, and investment. |
This guide provides the technical steps and strategic insights needed to master the relationship between county maps and ZIP codes.
## Why is accurate county and ZIP code mapping critical?
The core problem is that business-critical data—property taxes, zoning laws, school districts, and economic reports—is organized by **county**. However, marketing campaigns, lead generation, and initial property searches are almost always executed at the **ZIP code** level. An accurate crosswalk file connecting these two geographies is the only way to ensure decisions are based on the correct jurisdictional data, preventing costly errors and revealing opportunities missed by competitors.
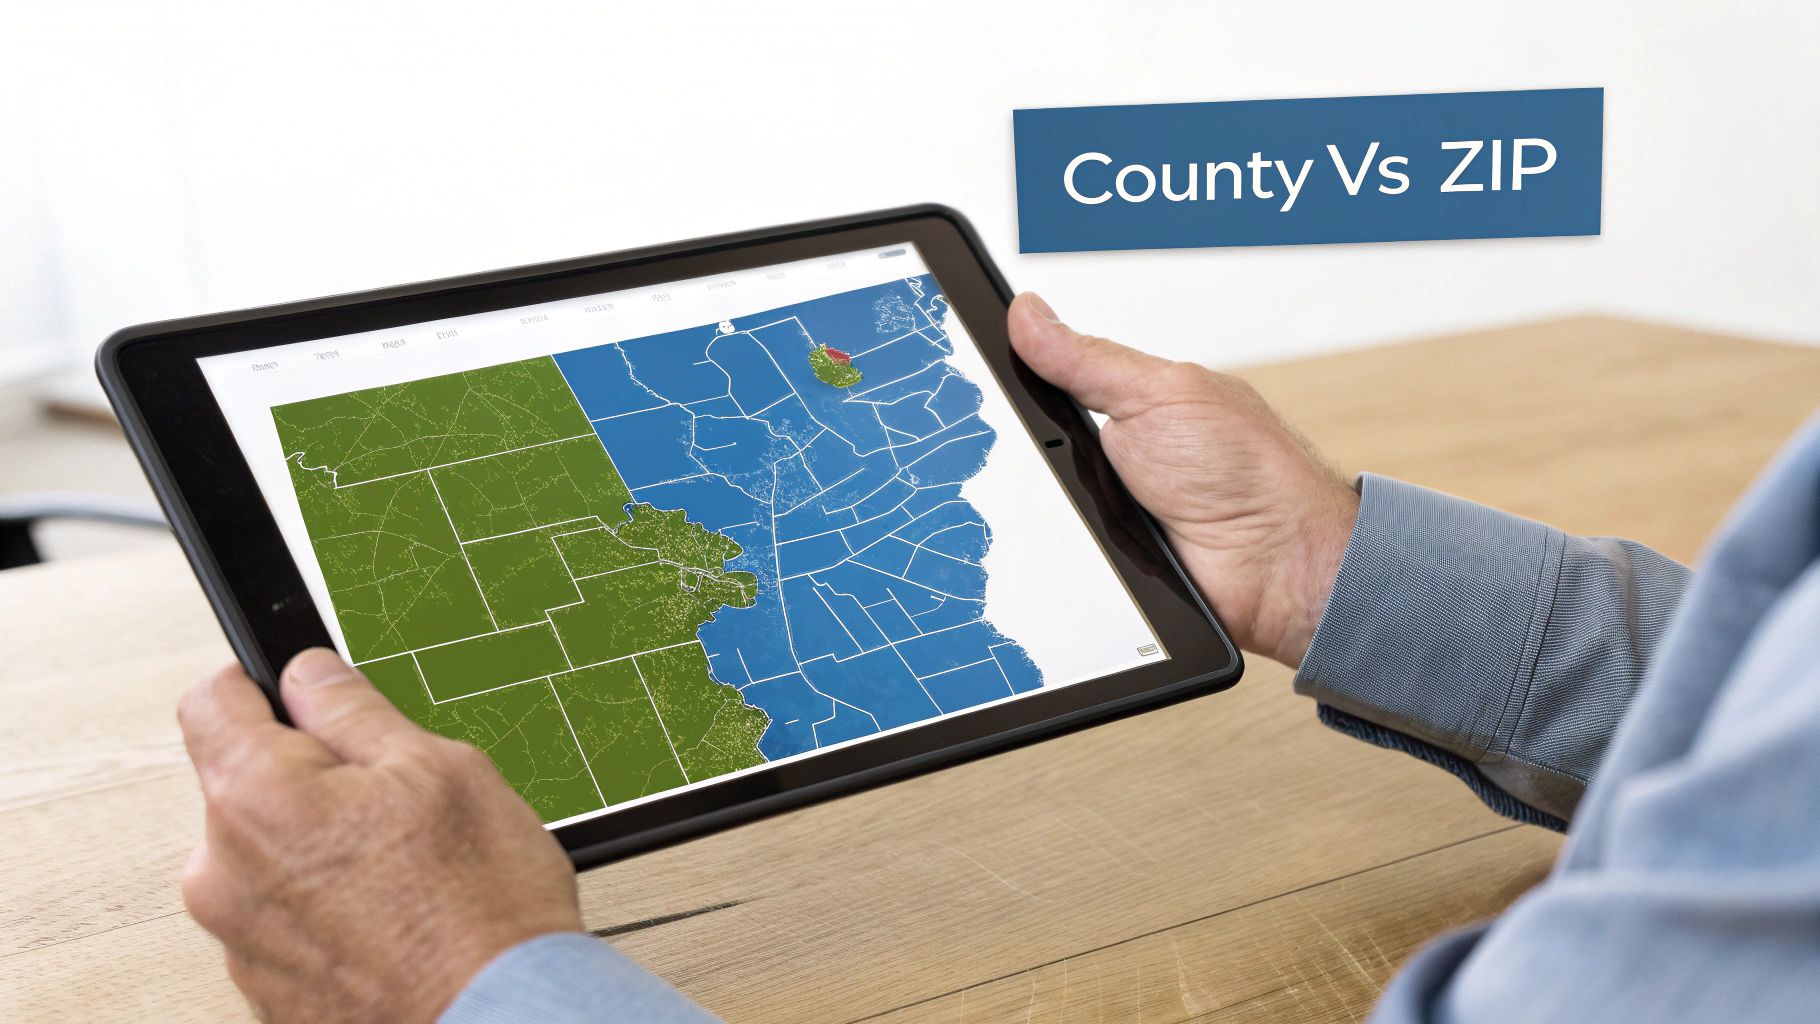
### The Geographic Mismatch
The conflict arises because ZIP codes and county lines were created for entirely different purposes.
- **ZIP Codes**: These are logistical tools for the USPS. They represent delivery routes, not enclosed geographic areas, and therefore frequently cross city, county, and even state lines. **ZIP code 42223**, for example, serves properties in both Christian County, Kentucky, and Montgomery County, Tennessee.
- **County Lines**: These are legally defined, static boundaries that determine tax jurisdiction, applicable laws, and local government services. They are precise and non-negotiable.
Relying on a ZIP code to determine a property's legal jurisdiction is a common and expensive error. A property with a mailing address of "Chicago, IL 60629" may physically reside in the village of Bedford Park, which has entirely different tax rates and ordinances than the city of Chicago.
> The ZIP Code system (<u>Zoning Improvement Plan</u>) was introduced on **July 1, 1963**. By 1967, its use was widespread, with **65% of all mail** including ZIP codes, a figure that grew to **83% of Americans** by 1969. More details are available on the history of ZIP codes from the Library of Congress.
### Real-World Business Applications
Solving this mapping problem is a strategic imperative that enables precise, data-driven decisions across the real estate sector. An accurate overlay of **county maps and ZIP codes** directly impacts everything from underwriting risk models to marketing campaign ROI. An insurance company, for instance, requires the correct county to apply appropriate risk models for floods or wildfires, while a mortgage lender must verify county-specific recording fees and property tax laws before closing.
The table below breaks down specific use cases.
### Key Use Cases for ZIP Code to County Mapping
| Industry Segment | Primary Use Case | Business Impact |
| :--- | :--- | :--- |
| **Mortgage Lending** | Portfolio Risk Analysis | Identify loan concentrations in counties with high delinquency or foreclosure rates. |
| **Insurance Underwriting**| Hazard Assessment | Accurately map properties against county-level flood zones or wildfire risk areas. |
| **Real Estate Investing**| Market Segmentation | Pinpoint high-growth ZIP codes within specific target counties for acquisition. |
| **Marketing & Proptech** | Hyper-Targeted Campaigns | Allocate marketing spend to ZIPs within counties showing strong demographic growth. |
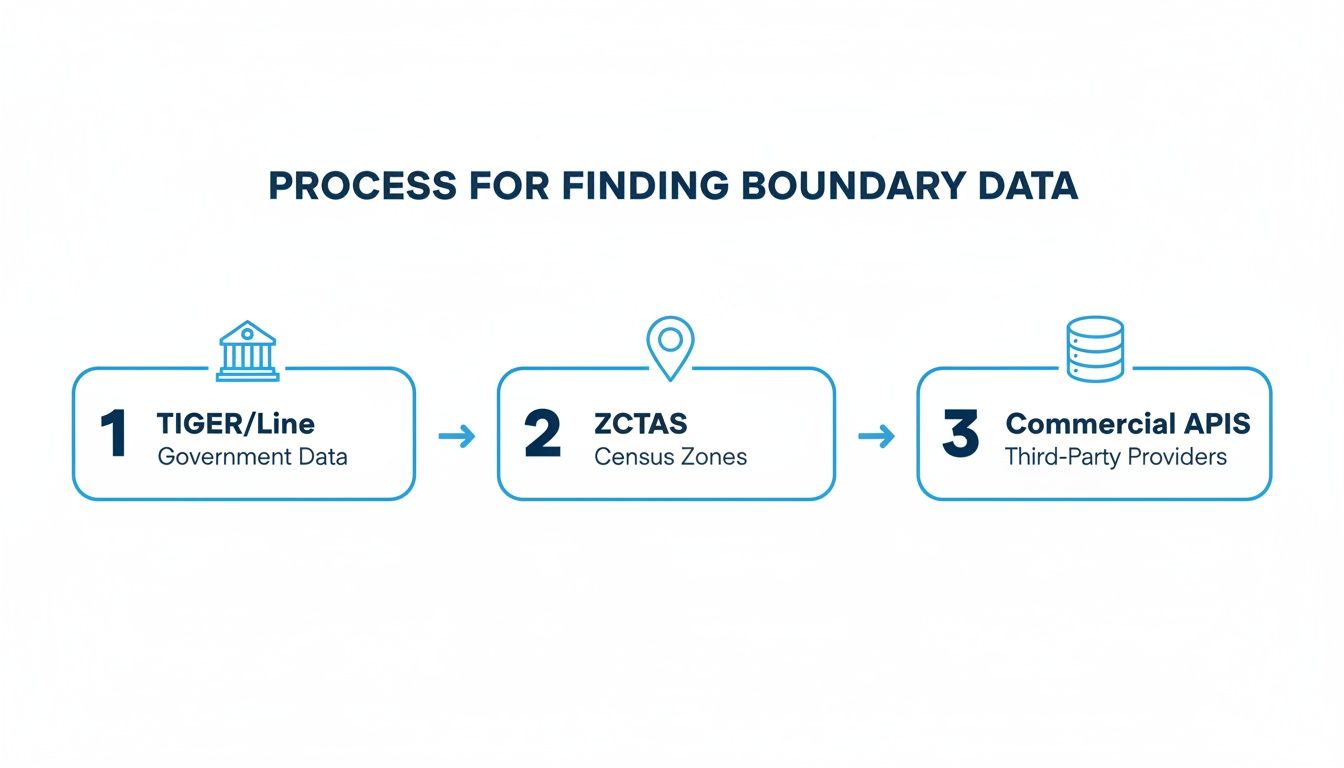
## Where can you find reliable geographic boundary data?
The **U.S. Census Bureau** is the authoritative source for U.S. geographic boundary data. This is the non-negotiable starting point for acquiring accurate county lines and the polygons needed to approximate ZIP codes. Effective geographic analysis requires spatial data files that define the precise shape and location of these areas, not simple lists.
### First, a Critical Distinction: ZCTAs vs. USPS ZIP Codes
Understanding the difference between a USPS ZIP code and a Census **ZIP Code Tabulation Area (ZCTA)** is critical to avoid invalidating your analysis.
- **USPS ZIP Codes**: These are not polygons. They are logistical collections of delivery routes created by the U.S. Postal Service for mail efficiency and often cross administrative boundaries.
- **ZCTAs**: These are statistical areas created by the Census Bureau to *approximate* the area covered by USPS ZIP codes. The Census aggregates address data by ZIP code and generates polygons representing those clusters. For any spatial or demographic analysis, **ZCTAs are the industry standard**.
As of October 14, 2025, there are **41,557** distinct ZIP Codes in the U.S., which were first proposed as a regional coding system in 1944 and expanded with the ZIP+4 extension in 1983.
### Accessing TIGER/Line Shapefiles
The primary source for both ZCTA and county boundary data is the Census Bureau's **TIGER/Line Shapefiles** database. TIGER (<u>Topologically Integrated Geographic Encoding and Referencing</u>) is the national repository for U.S. cartographic data. This is where you can download the vector data files required for mapping these boundaries in any GIS software.
When using the portal, select the year and layer type (e.g., ZCTAs or Counties). Always download the version most relevant to your analysis timeframe, as data is updated periodically. While official sources provide boundaries, supplementary tools like a [Google Maps Places Scraper](https://www.clura.ai/templates/google-maps-places-scraper) can enrich your map with additional location-based data points.
### Common Data Formats
The TIGER database provides files in several standard formats.
- **Shapefile (.shp)**: The standard for GIS. A shapefile is a collection of files (.shp, .shx, .dbf) that must be kept together.
- **GeoJSON (.json or .geojson)**: A modern, lightweight format ideal for web mapping and easier to parse with code.
- **KML (.kml)**: Originally for Google Earth, useful for quick visualizations but not for heavy-duty spatial analysis.
> The primary challenge is not the download but the significant data engineering effort required to clean, join, and maintain raw government data before it is business-ready.
### The Alternative: Commercial Data Providers
For teams without the resources for extensive data engineering, commercial data providers offer a direct path to analysis-ready datasets. Platforms like **BatchData** provide curated, cleaned, and validated boundary data and crosswalks. This approach replaces weeks of data preparation with a single API call, freeing your team to focus on building models and identifying opportunities. For a deeper dive, explore our guide on the [comprehensive list of zip codes and counties](https://batchdata.io/uncategorized/list-of-zip-codes-and-counties).
## How do you build a ZIP code to county crosswalk file?
The foundational asset for geographic analysis is the **ZIP code to county crosswalk file**. This file acts as a bridge between the logistical world of postal codes and the legal boundaries of counties. The primary technique used to create it is a **spatial join**, which involves overlaying ZCTA and county boundary map layers to identify intersections. This process also addresses the main challenge: handling ZIP codes that cross multiple county lines.
The workflow begins by acquiring reliable boundary files for both ZCTAs and counties, either from government sources like TIGER/Line or through commercial APIs.
### Tools for Building a ZIP to County Crosswalk
Powerful open-source tools are available for this task. The choice of tool depends on technical comfort and project scale.
| Tool | Best For | Key Feature | Learning Curve |
| :--- | :--- | :--- | :--- |
| **QGIS** | Visual learners, manual one-off projects | Intuitive graphical user interface (GUI) | Low to Medium |
| **GeoPandas (Python)** | Data scientists, developers needing automation | Scalable and integrates with Python data ecosystem | Medium to High |
| **PostGIS (PostgreSQL)** | Large-scale, database-driven workflows | Powerful spatial SQL queries for complex joins | High |
| **BatchData API** | Teams needing analysis-ready data immediately | Pre-built, validated crosswalks via API call | Very Low |
This guide focuses on [QGIS](https://qgis.org/en/site/) for a visual approach and [GeoPandas](https://geopandas.org/) for a programmatic one, as these cover most use cases.
### Performing the Spatial Join in QGIS
QGIS is a free, open-source Geographic Information System with a user-friendly interface.
1. **Load Layers**: Add the downloaded ZCTA and county shapefiles as vector layers into a new QGIS project.
2. **Run Join Tool**: Navigate to **Vector > Data Management Tools > Join Attributes by Location**.
3. **Configure Join**: Set the ZCTA layer as the "base layer" and the county layer as the "join layer." Select **"intersects"** as the geometric predicate.
4. **Execute and Review**: The output is a new layer containing your ZCTAs, now with county information (e.g., name, FIPS code) appended to each record it intersects.
This initial join will reveal duplicate records for any ZCTA that intersects multiple counties, which requires further processing.
### Tackling Edge Cases with a Weighted Crosswalk
A simple intersection join is insufficient for professional analysis. The industry standard is a **weighted crosswalk**, which calculates the percentage of a ZCTA's total area that falls within each county it overlaps. This allows for the proportional allocation of data. For instance, if a ZCTA is **70%** in County A and **30%** in County B, metrics like population or sales volume can be apportioned accurately. This level of detail is typically handled more efficiently with code.
For property-specific needs, you may need to [find a county using just an address](https://batchdata.io/blog/find-county-using-address).
> The complexity exists because ZIP codes were designed for mail delivery, not statistical analysis. The USPS noted the "unforeseen" use of ZIP codes for market segmentation as far back as its **1967** Annual Report.
### Building a Crosswalk Programmatically with GeoPandas
For a scalable and precise solution, Python's GeoPandas library is the optimal tool. It combines the data manipulation capabilities of pandas with spatial operations.
The conceptual script workflow is:
1. **Import Libraries**: Begin by importing `geopandas`.
2. **Load Data**: Read the ZCTA and county shapefiles into two separate GeoDataFrames.
3. **Ensure CRS Match**: *Crucially*, both GeoDataFrames must have the same Coordinate Reference System (CRS). Check with `gdf.crs` and re-project if necessary.
4. **Perform Spatial Join**: Use the `gpd.sjoin()` function to join the two data frames where their geometries intersect.
5. **Calculate Area & Weight**: Calculate the geographic area of each overlapping segment. Then, group the data by ZCTA to determine the percentage of its total area within each county.
This programmatic method produces a clean, accurate, and weighted crosswalk file that quantifies the exact proportion of the relationship between a ZCTA and the counties it intersects.
## How do you visualize real estate data on your county map?
A crosswalk file's value is only realized through visualization. Transforming a spreadsheet of **county maps and ZIP codes** into a dynamic map turns raw data into a strategic tool that reveals market patterns invisible in tables. The goal is to create interactive visualizations that identify investment hotspots, areas of distress, and emerging opportunities at a glance.
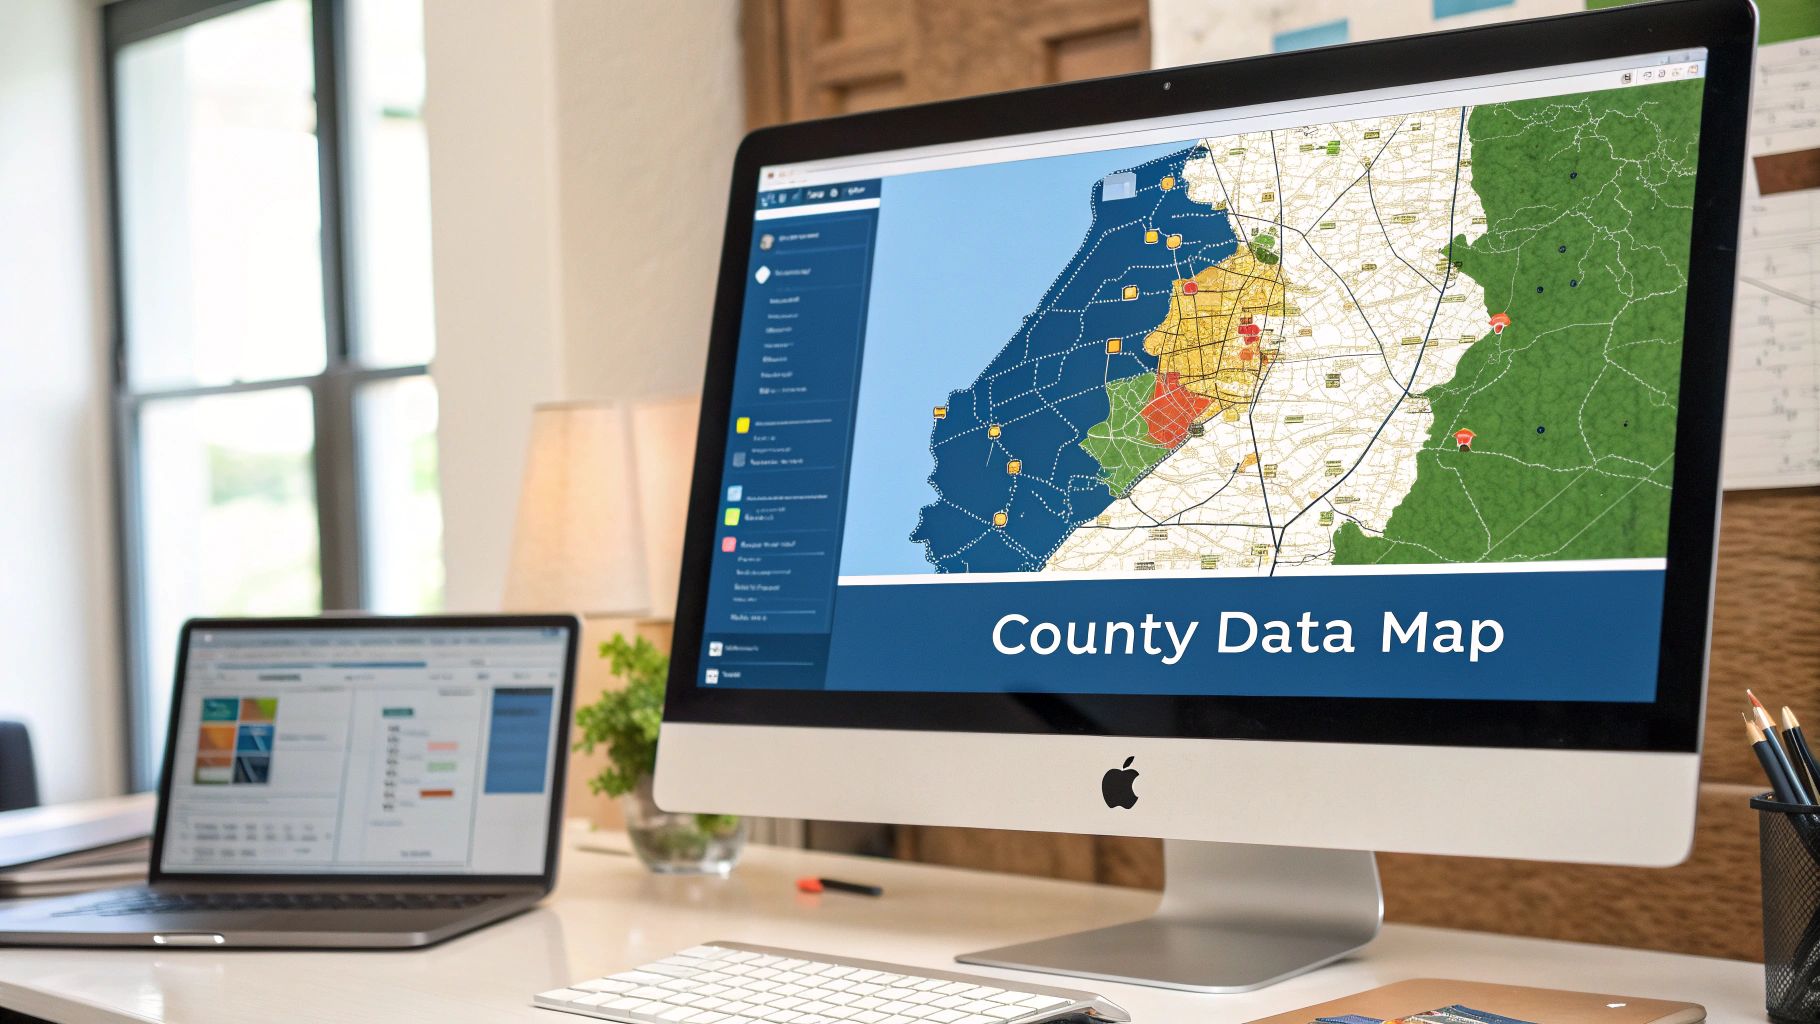
This Mapbox example illustrates a data-rich map where color-coded regions and data points create a powerful analytical dashboard, making trends in property density, value, or risk immediately apparent.
### Creating a Choropleth Map
A **choropleth map** is one of the most effective visualization techniques for this data. It is a map where geographic areas, such as counties, are shaded in proportion to a specific variable.
Common real estate applications include:
- **Average Property Value**: Shading counties with higher average home prices in a darker blue.
- **Foreclosure Rates**: Using a red gradient to highlight counties with a spike in foreclosure activity.
- **Investor Activity**: Visualizing the number of properties acquired by LLCs in each county.
This technique transforms a complex dataset into an intuitive visual narrative, enabling rapid comprehension of market dynamics.
### Choosing Visualization Tools
Several tools can create these visualizations, from BI platforms to web mapping libraries.
- **Business Intelligence (BI) Platforms**: **Tableau**, **Power BI**, and **Looker** have built-in mapping capabilities that handle shapefiles and join them with business data, facilitating the creation of interactive dashboards.
- **Web Mapping Libraries**: For custom applications, developer-focused libraries like **Leaflet.js** (open-source) or **Mapbox GL JS** (more powerful) provide complete control over interactivity, styling, and data layers.
Understanding [how to use MapView to build location-aware apps](https://vermillion.agency/insights/how-to-use-mapview/) is essential for bridging data with a functional user experience.
> Effective choropleth maps use clear color schemes. Avoid rainbow palettes, which are difficult to interpret. Instead, use a single-hue sequential scheme (light blue to dark blue) for continuous data or a diverging scheme (red-to-blue) to show deviation from a central value.
### Enhancing Your Map with Layers and Interactivity
A basic choropleth map is a starting point. True power comes from layering additional data and enabling interactivity to create a multi-dimensional view.
#### Adding Interactive Tooltips
This feature is essential. When a user hovers over a county, a tooltip should appear with key metrics for that area, allowing for quick on-the-fly analysis.
Minimum tooltip data includes:
1. **County Name and State**
2. The primary metric being visualized (e.g., "Average Sale Price: $450,000")
3. Supporting data points (e.g., "Total Properties: 12,500," "YoY Growth: +8.5%")
#### Layering Property-Level Data
This connects the macro (county trends) with the micro (individual properties). By integrating a property data API, you can overlay the locations of specific assets onto your map. This approach helps answer critical business questions like, "Are our assets concentrated in the highest-growth counties?" or "Which distressed properties are located in areas with strong market fundamentals?" Context on how [geospatial mapping tracks property trends in our detailed guide](https://batchdata.io/blog/how-geospatial-mapping-tracks-property-trends) can elevate your map from a simple report to a strategic planning tool.
## How can you apply this map in Proptech and real estate?
The technical work of building crosswalks and visualizations is only valuable when it drives a business outcome. An accurate map of **county maps and ZIP codes** is a decision-making engine that provides a competitive advantage in high-stakes scenarios across mortgage lending, insurance underwriting, and targeted marketing. It enables a proactive strategy based on identifying risks and uncovering hidden opportunities with precision.
### Driving Decisions in Mortgage Lending and Insurance
For risk-based industries, geographic accuracy is paramount. Enriched maps provide a granular view of portfolio exposure and support smarter underwriting decisions. A mortgage lender can visualize its loan portfolio on a choropleth map showing county-level delinquency rates, immediately highlighting risk concentrations. If **35%** of loans are concentrated in three counties showing economic distress, this triggers immediate action, such as tightening lending criteria in those specific areas.
Similarly, an insurance carrier can map policies against county-level hazard data like [FEMA flood zones](https://www.fema.gov/flood-maps) or wildfire risk models to:
- **Refine Underwriting Rules**: Apply stricter standards or adjust premiums in specific ZIP codes within high-risk counties.
- **Manage Portfolio Concentration**: Avoid overexposure in a single geographic area vulnerable to a catastrophic event.
- **Streamline Claims Processing**: Instantly identify all affected policyholders within impacted county lines following a natural disaster.
### Pinpointing Opportunities for Marketing and Investment
For real estate investors and marketers, these maps are invaluable for optimizing budget allocation. Instead of broad, city-level campaigns, resources can be focused on specific ZIP codes *within* counties exhibiting the strongest growth signals. An investment firm can analyze a metro area by shading counties based on population growth and then layering property-level data showing appreciation rates. This approach reveals hidden gems—specific ZIP codes outperforming the rest of the county—allowing for surgically precise acquisition and marketing efforts with a much higher ROI.
> This hyper-targeting is a competitive necessity. In a cutthroat market, the ability to act on micro-market trends determines success. A single ZIP code straddling two counties with different economic forecasts presents both risk and opportunity, visible only with an accurate map.
### Enriching Maps with Real-Time Property Data APIs
Dynamic, API-driven maps are superior to static ones. Integrating a real-time property data API injects visualizations with thousands of attributes for any given property, creating a powerful analytical tool.
This screenshot shows the granular data available through an API like [BatchData's Property Search](https://www.batchdata.com/docs/property-search).
This level of detail enables on-the-fly due diligence directly within the map view. Instead of just seeing average home values, users can filter for specific, actionable opportunities.
1. **For Wholesalers**: Visualize every property in a target ZIP code with high equity and an absentee owner.
2. **For Lenders**: Map all properties in a county with an active pre-foreclosure notice to find refinancing leads.
3. **For Marketers**: Identify properties owned for **10+ years** in a ZIP code with soaring home values to target potential sellers with direct mail.
This API-driven approach transforms a map from a historical report into a living tool for real-time market analysis and lead generation, closing the gap between high-level strategy and property-level action.
## What are the most common questions about ZIP code and county mapping?
Answering common questions about mapping ZIP codes to counties can prevent significant analytical errors.
### Why can't I just use a simple list of ZIPs and counties?
A simple list is unreliable because **ZIP codes do not respect county boundaries**. They were created by the USPS for mail delivery efficiency, not to align with geographic or political areas. A single ZIP code frequently crosses multiple county lines, making a one-to-one list fundamentally flawed. For example, ZIP code **60629** covers land in both the city of Chicago (Cook County) and the village of Bedford Park, each with different local laws and tax structures. Using a simple list would result in incorrect data for one of those jurisdictions.
### What is a ZCTA and why does it matter?
A **ZCTA**, or <u>ZIP Code Tabulation Area</u>, is the U.S. Census Bureau's solution to this problem. ZCTAs are statistical areas that approximate the geographic footprint of a USPS ZIP code. While a postal ZIP code is merely a collection of delivery routes, a ZCTA provides a stable, mappable polygon boundary essential for spatial analysis. For any demographic, market, or risk analysis involving **county maps with zip codes**, ZCTAs are the gold standard.
### How do I handle a ZIP code that crosses county lines?
The most accurate method is to build a **weighted crosswalk**. This process calculates the precise percentage of a ZCTA's geographic area that falls within each county it intersects. While a basic spatial join identifies an overlap, a weighted approach provides essential context.
For a ZCTA with a total area of **10** square miles:
- If **7** square miles (**70%**) are in County A,
- And **3** square miles (**30%**) are in County B,
You can proportionally allocate data. If the ZCTA has **1,000** households, you can estimate that **700** are in County A and **300** are in County B, leading to more defensible conclusions.
### What is the single biggest mistake people make?
The most common and costly mistake is assuming a property's mailing address city determines its legal jurisdiction. City names in mailing addresses are often convenient labels that cover wide areas, including suburbs in different counties with distinct regulations. For example, a commercial property in California may have a Santa Clara mailing address while a portion of the building physically sits in San Jose. San Jose has a paid sick leave ordinance that Santa Clara does not. An employer relying solely on the mailing address for compliance could face significant legal and financial risk. This illustrates why precise boundary data is non-negotiable.
---
Ready to stop wrestling with raw geographic files and get analysis-ready data instantly? **BatchData** provides pre-built, validated ZIP-to-county crosswalks and over 1,000 property attributes via our powerful APIs. Skip the data engineering and start making smarter decisions today. Explore our property data solutions at [https://batchdata.io](https://batchdata.io).