
If I had to boil this down to one point, it’s this: real estate teams usually need five data checks before outreach starts – market, parcel, zoning, hazard, and owner contact. The article lays out the tools that fit each step, from ArcGIS, QGIS, and Google Maps Platform for search, to Regrid, CoreLogic, and county GIS for parcel checks, Zoneomics and city zoning maps for land-use review, FEMA, First Street, and state hazard maps for risk, and BatchData for owner and contact records.
Here’s the short version:
- Use mapping tools to find target areas and narrow them to parcels
- Use parcel data to confirm boundaries, APNs, land use, and assessor facts
- Use zoning data to check what a site can support, including overlays
- Use hazard data to screen flood, wildfire, wind, heat, and other risk
- Use owner enrichment to turn parcel lists into call-, mail-, and CRM-ready records
A few numbers stand out:
- Zoneomics covers 22,000+ U.S. jurisdictions
- CoreLogic includes 200+ parcel fields
- FEMA flood zones A, AE, and VE mark areas with a 1% annual flood chance
- First Street Risk Factor uses 1–10 scores
- Contact data can decay fast, with email turnover at 23% to 30% per year and overall data accuracy dropping by about 22.5% annually
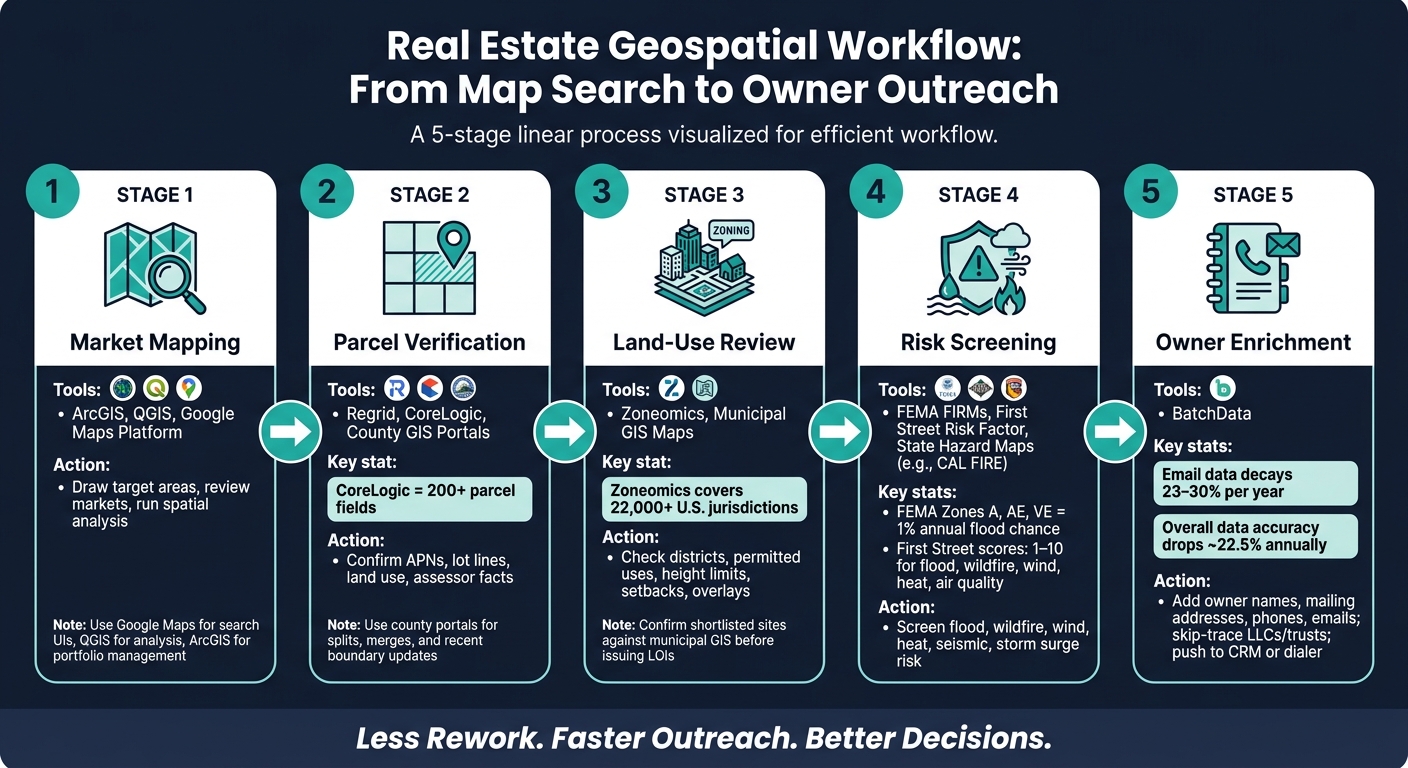
Real Estate Geospatial Workflow: From Map Search to Owner Outreach
Mapping to Millions: Real Estate Riches With GIS Parcel Intelligence | Sponsored by Esri

Quick Comparison
| Tool group | Main job | Common tools | What I’d use it for |
|---|---|---|---|
| Mapping | Search and map review | ArcGIS, QGIS, Google Maps Platform | Draw target areas, review markets, run spatial analysis |
| Parcel data | Parcel checks | Regrid, CoreLogic, county GIS | Confirm APNs, lot lines, land use, assessor facts |
| Zoning | Land-use review | Zoneomics, municipal GIS maps | Check districts, permitted uses, height, setbacks, overlays |
| Hazard | Risk screening | FEMA, First Street, state maps | Review flood, wildfire, wind, heat, seismic, surge |
| Owner enrichment | Outreach prep | BatchData | Add owner names, mailing addresses, phones, emails |
My main takeaway: this isn’t about picking one tool. It’s about building a clean flow from map search to owner outreach with fewer bad parcels, fewer data gaps, and less wasted time.
That’s the lens I’d use to read the full piece.
Mapping and Parcel Data Tools for Market Search and Property Validation
Mapping and parcel tools help teams shrink a broad market into a workable shortlist of parcels. The usual flow is simple: draw a search area, pull in the parcels inside it, and filter by lot size, shape, land use, and assessor value.
Esri ArcGIS, QGIS, and Google Maps Platform for Visual Search and Spatial Analysis
Esri ArcGIS is built for enterprise GIS teams, QGIS works well for technical analysts, and Google Maps Platform is a fit for product teams building map-based tools.
Esri ArcGIS – including ArcGIS Pro and ArcGIS Online – supports advanced spatial analysis like drive-time trade areas, suitability analysis, and network routing. It also lets teams combine assessor data, demographics, and market indicators in shared web maps and dashboards.
Mid-America Real Estate Group reported that ArcGIS Business Analyst improved site selection by combining consumer data, demographics, and geospatial analytics.
ArcGIS also includes a Parcel Value Analysis solution for visualizing property traits, reviewing sales ratios, and spotting neighborhood patterns across markets.
QGIS is open-source and free, which makes it a good option for technical analysts and boutique firms that want strong desktop GIS without per-seat license fees. Teams can use QGIS to load parcel and assessor layers, run spatial joins, and flag large lots with low improvement values. That can help surface underused sites inside a target submarket.
Google Maps Platform is a fit for teams building internal deal tools, broker portals, or field apps that need embedded maps and search.
Homesearch used Google Maps Platform to power a map-led property intelligence platform, enabling intuitive, interactive exploration of comprehensive property data at production scale.
Many teams mix these tools instead of picking just one. A common setup looks like this:
- Google Maps Platform for search interfaces
- QGIS for analysis
- ArcGIS for portfolio and territory management
Regrid, CoreLogic, and County GIS Portals for Parcel and Boundary Verification
Parcel accuracy matters. A bad boundary or APN can distort lot size, miss an easement, or send outreach to the wrong owner.
| Source | Coverage | Data Depth | Best Use |
|---|---|---|---|
| Regrid | Nationwide, standardized schema | Parcel polygons, APN, owner type, land use, building footprints | Multi-market mapping, portfolio-wide analysis, API integration |
| CoreLogic | Nationwide, deep property records | Tax, deed, foreclosure, sale history, valuation details | Institutional underwriting, risk modeling, lender due diligence |
| County GIS portals | Single county or region | Parcel boundaries, APNs, assessor values, sometimes zoning | Final boundary verification, edge cases, entitlement packages |
CoreLogic provides 200+ parcel fields, including tax, deed, foreclosure, and valuation data, for underwriting and risk models. Regrid provides a standardized national schema through API or bulk file delivery for underwriting pipelines and custom apps.
County GIS portals still serve as the source to check edge cases. If a parcel was split, merged, or adjusted not long ago, county records often show that change sooner than national datasets. In practice, teams use Regrid or CoreLogic for scale, then check splits, merges, and recent boundary updates in the county portal before locking in a shortlist or entitlement package.
Once parcels are verified, zoning and hazard layers test what the site can support and how much risk remains.
sbb-itb-8058745
Zoning and Hazard Layers for Entitlement Checks and Risk Screening
Once parcels are verified, the next question is simple: can the site support the planned use, and what risks change the deal math? Zoning and hazard layers help answer both up front.
Zoneomics and Municipal GIS Zoning Maps for Development and Acquisition Review
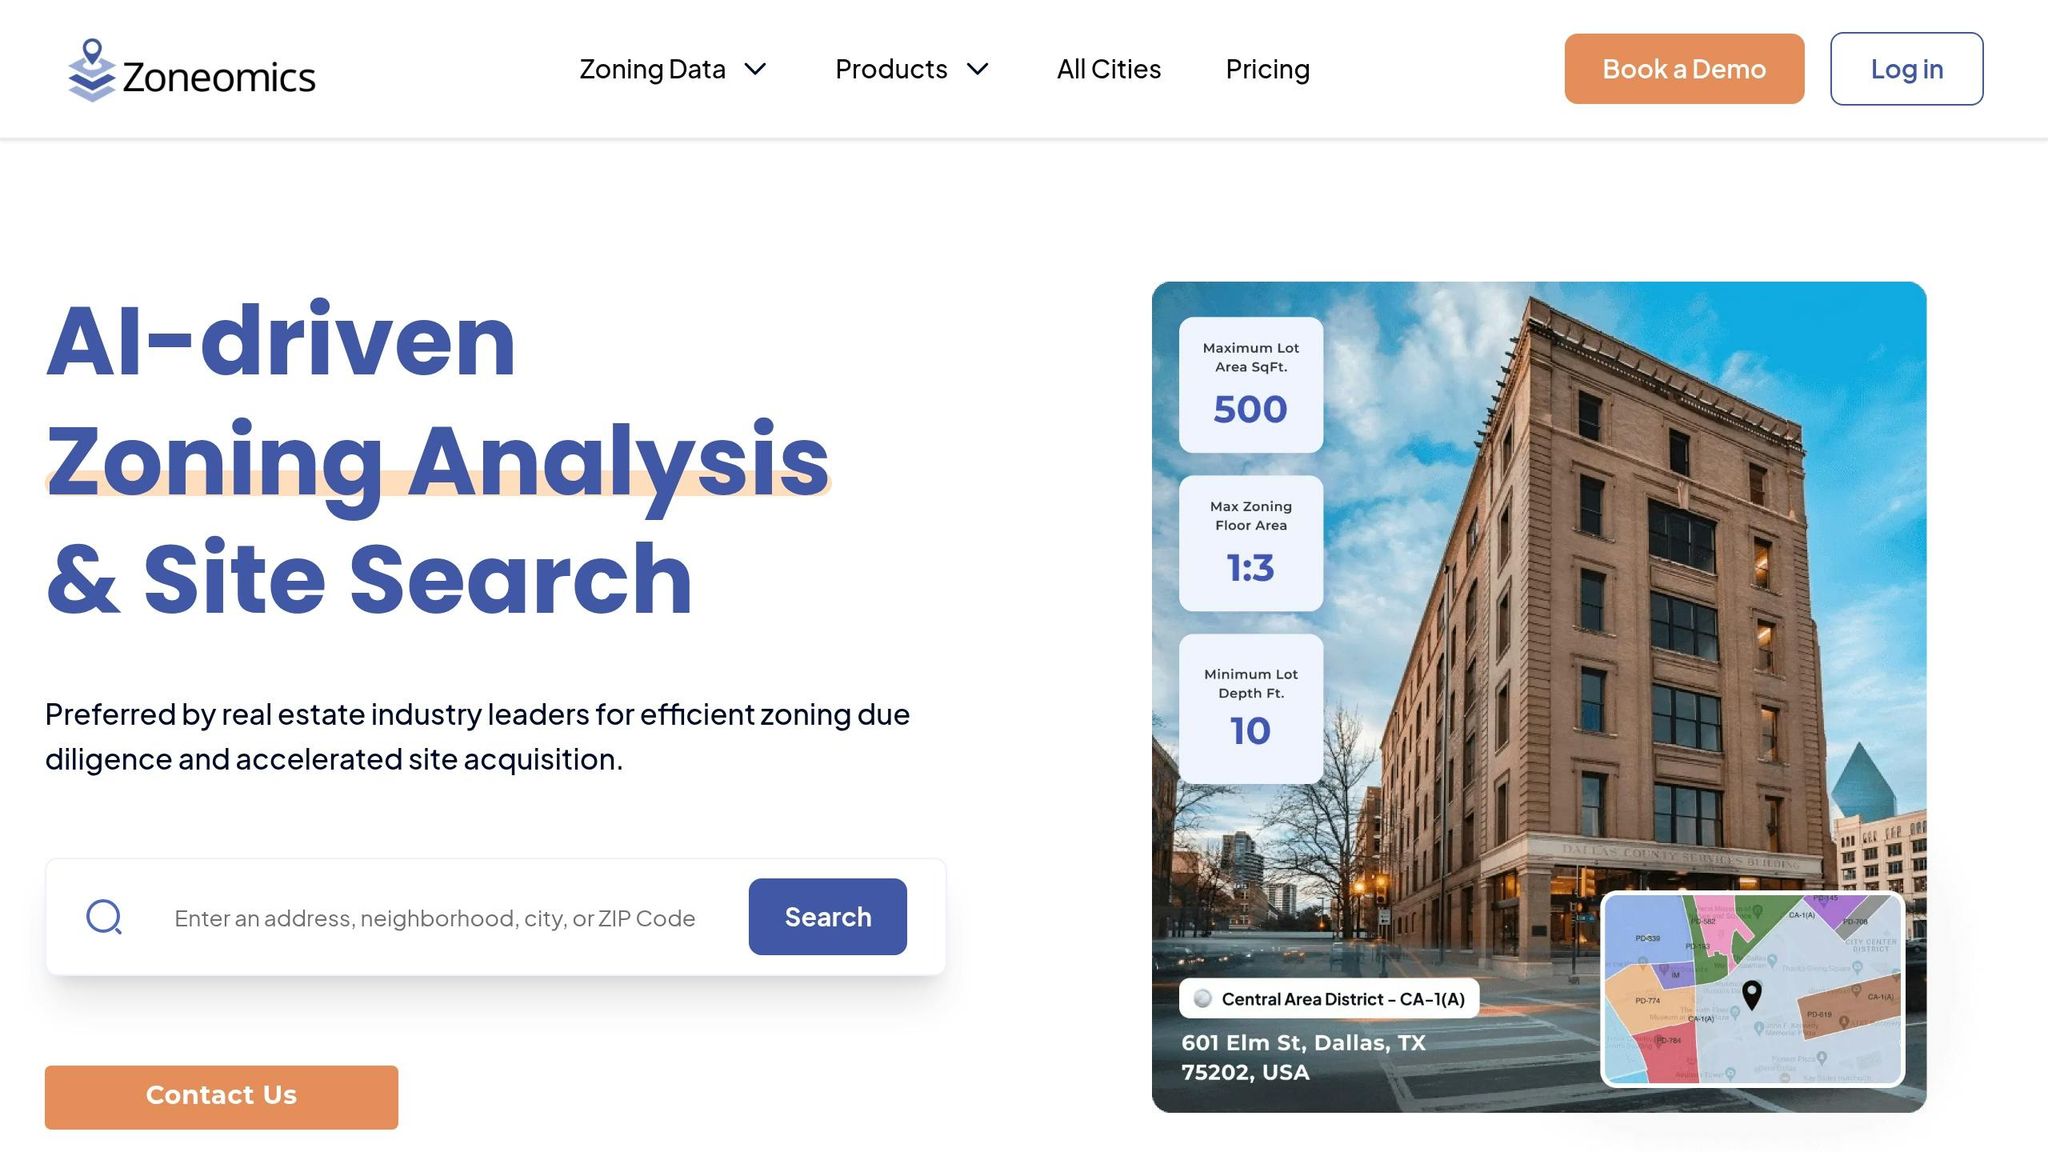
For most acquisition and development teams, zoning review starts with two sources used side by side. Zoneomics pulls planning and land-use data from fragmented municipal sources across 22,000+ jurisdictions into one standardized mapped platform, with APIs and bulk data delivery. It covers zoning designations, permitted uses, setbacks, height limits, and density. That kind of lookup makes it much easier to screen large site lists fast.
But municipal GIS zoning maps are still the source that counts most. They tie zoning code text directly to parcel shapes, so a user can click a parcel and see the zoning district, permitted uses, and dimensional standards from the local ordinance right away. The catch? Coverage, format, and update timing vary a lot by jurisdiction, and some smaller towns still rely on static PDFs.
A practical workflow is to use both. Start with Zoneomics, or a similar tool, for fast triage. Then confirm shortlisted sites against the municipal GIS map and the zoning code before issuing LOIs or signing purchase agreements. On high-dollar deals, the last step is often a formal zoning verification letter from the planning department before zoning assumptions are treated as firm enough for underwriting.
One thing teams often miss early on is overlay districts. Base zoning can look fine on paper, but an overlay may change what you can build. Many municipal GIS maps now show overlays as toggleable layers, and tools like Zoneomics include overlay data in standardized reports. Catching those conflicts in the first pass can save a team from chasing sites that look good at first glance but are boxed in once the fine print shows up.
That gets the shortlist ready for risk review.
FEMA, First Street, and State Hazard Maps for Flood, Wildfire, and Climate Exposure
Once zoning checks out, the next step is risk. Hazard screening usually runs in parallel with zoning review because the deal can fall apart just as fast on insurance, code, or climate exposure as it can on land use. FEMA FIRMs and First Street Risk Factor scores each play a different role.
FIRMs set the official flood zones used by insurers, lenders, and local governments. Properties in Zones A, AE, and VE – the Special Flood Hazard Areas – face at least a 1% annual chance of flooding and usually trigger mandatory flood insurance for federally backed mortgages. That cost flows straight into operating expenses and NOI. Shaded Zone X marks the 500-year floodplain. It brings less regulatory pressure, but it still deserves a close look.
First Street’s Risk Factor scores fill in a gap that FEMA maps don’t. Each property gets a 1–10 score for flood, wildfire, hurricane wind, extreme heat, and air quality, based on modeled probability and expected loss, not just past flood boundaries. First Street also includes climate projections, so a property just outside a current FEMA high-risk area may still show elevated modeled flood risk over a multi-decade hold period. For long-term deals, that can change how you stress-test IRR and insurance costs.
| Hazard Source | Coverage | Key Output | Best Use |
|---|---|---|---|
| FEMA FIRMs | Nationwide | Flood zone classification (A, AE, VE, X) | Regulatory compliance, lender requirements, insurance baseline |
| First Street Risk Factor | Nationwide | 1–10 scores for flood, wildfire, wind, heat, air quality | Forward-looking risk, underwriting stress tests, portfolio segmentation |
| State hazard maps (e.g., CAL FIRE) | State/regional | Wildfire severity zones, seismic, storm surge | Peril-specific insurance pricing, site selection, resilience planning |
State-level layers round out the view. CAL FIRE’s Fire Hazard Severity Zone maps sort California properties by wildfire exposure using terrain, vegetation, weather patterns, and fire history. Coastal states publish hurricane wind speed and storm surge maps that affect building codes and insurance pricing. Seismic and landslide hazard maps matter in California, Washington, and Oregon for structural design and permitting. Stack these layers in one GIS view and you can see a candidate property’s full hazard profile before anyone spends time on a site visit. That leaves a cleaner shortlist for owner and contact enrichment.
Owner and Contact Enrichment Tools That Turn Mapped Properties into Outreach-Ready Records
After parcel, zoning, and hazard review, the next step is getting ownership data you can actually use for outreach. A shortlist of parcels isn’t enough on its own. You still need verified owner and contact details. The first pass is simple: enrich the list, then check who you can reach.
BatchData for Property and Contact Enrichment
BatchData – Ivo Draginov fills that gap. After a GIS analyst exports a filtered parcel list – usually a CSV with APNs, property addresses, and coordinates – BatchData can return enriched records with owner names, mailing addresses, phone numbers, email addresses, and key property attributes.
For properties held in LLCs or trusts, skip tracing can help identify the person behind the entity instead of stopping at the legal name. That’s a big deal for investor-owned or absentee-owner lists, where the owner on record often isn’t the person who picks up the phone.
Verification also helps weed out bad phone numbers and undeliverable mailing addresses before outreach starts. That matters because contact data goes stale fast, with email turnover at 23% to 30% each year and overall accuracy falling by about 22.5% annually.
Teams that need scale or automation can use BatchData’s property search API to query by address, APN, or coordinates and get enriched records in real time. High-volume acquisition teams can also run nightly or weekly enrichment jobs, so new GIS-based parcels move through the pipeline without a manual upload. Bulk data delivery supports CSV-based workflows for teams that work in data warehouses or CRMs, and professional services can help with integration, field mapping, and pipeline setup.
Where Enrichment Fits in the Workflow
In day-to-day use, enrichment is more than a simple data append. It’s a quality-check step that belongs right after parcel selection, during list QA, and again before launch.
After parcel selection, enrichment shows how many parcels have at least one verified phone number or a confirmed mailing address. During list QA, these tools can flag duplicates, standardize addresses to USPS Publication 28 formats, and mark records where the owner is an entity that needs more work. Before launch, one last verification pass keeps contact fields current, which can improve call connect rates and cut down on returned mail.
Use APN as the main key instead of the street address. That helps prevent duplicate records when the same property shows up across multiple datasets, and it makes matching enriched records back to the original GIS export much easier. From there, teams can push records into CRMs or dialers with owner flags like absentee status, ownership tenure, and equity position already attached. That lets acquisitions teams segment and sequence outreach without extra data prep. Once the records are clean, they can move straight into outbound systems.
How to Choose the Right Geospatial Stack for Your Team
After mapping, parcel review, zoning checks, hazard screening, and enrichment, the next move is pulling those tools into one working flow. Pick the stack that matches how your team makes decisions, not the one with the longest feature list. If a tool can’t export clean records, it creates drag for the next step.
Best Fit by Role and Workflow Stage
Team size and technical skill shape the best setup. The simplest way to choose is by workflow stage, not by product label:
- Search – Mapping platforms for market views and site discovery
- Validate – Parcel APIs, zoning layers, and hazard feeds to confirm what a site can support and what risks still sit on the table
- Enrich – Owner and contact enrichment to turn verified parcels into outreach-ready records
When a decision affects price, entitlement, or underwriting, use county or municipal source data.
Conclusion: Build a Workflow That Starts with Geography and Ends with Action
A strong stack should follow the same path as the deal itself. Mapping tools define the shot. Parcel data confirms the asset. Zoning and hazard layers help cut bad bets before money goes out the door. Owner enrichment tools – like BatchData – turn the remaining targets into outreach-ready records with verified contacts, skip-traced ownership, and clean fields that move straight into CRMs or dialers.
Once the tools are in place, the last test is simple: does each step pass clean data to the next one? Start with geography, end with action. The aim is clear: less rework, faster outreach, and better decisions.
FAQs
What is the best order to use these tools?
Use them in a simple sequence: identify, validate, then enrich.
Start with a mapping or property search tool to find candidate properties by location, price, and size. Then confirm the APN so your legal and tax-record details line up. Once you’ve verified the parcel, add hazard data for screening and contact enrichment or skip tracing to get verified owner information.
When should I verify data with county or city sources?
Use county or city sources when you need to confirm property-specific details like an APN, deeds, liens, or tax status.
Why does that matter? Because official assessor and recorder records are the starting point for cross-checking. Public records can contain errors, and even one wrong digit can affect a transaction.
How often should I refresh owner contact data?
Refresh owner contact data every day so your outreach info stays current and as accurate as possible.
Updating property and contact records each day, including phone numbers and email addresses, also helps support compliance with rules such as the DNC list and TCPA.