Understanding historical property value trends is essential for smarter real estate decisions. Here’s what you need to know:
- U.S. home prices have grown by an average of 4.3% annually since 1991, with inflation-adjusted growth much lower at 0.5% annually since 1891.
- Market cycles matter: Prices can surge or drop dramatically (e.g., +14% in 1979, −15% in 2009). Local data often deviates from national trends.
- Tools like the Case-Shiller Index and FHFA House Price Index track price changes, offering insights into market dynamics at national, state, and local levels.
- Inflation and income trends intersect with home prices: By early 2026, buying a median-priced home requires a household income 57% higher than the U.S. median of $79,000.
- Localized data and tools like BatchData provide granular insights – critical for real estate investing professionals aiming to assess risks and opportunities.
This guide explores pricing metrics, market drivers, and data sources, offering actionable insights for real estate professionals.
What 75 Years of Home Prices Reveal About Today’s Market…
sbb-itb-8058745
Foundations of Historical Property Value Trends
Let’s delve into the analytical tools and trends that have shaped property values over time, following our earlier discussion on market dynamics.
Core Pricing Metrics
The median sale price is often highlighted in market reports, but it can give a distorted picture. For instance, a rise in luxury home sales can push the median higher even if overall values remain flat.
To address this, repeat-sales indexes – like the FHFA House Price Index (HPI) and the Case-Shiller Index – focus on price changes for the same properties over time. This method removes the variability caused by differences in property quality. The FHFA explains this as maintaining a "constant quality" perspective:
"This technique helps to control for differences in the quality of the houses comprising the sample and is why we refer to the FHFA HPI® as a ‘constant quality’ index." – FHFA
Another approach, hedonic price modeling, uses regression analysis to break down a property’s value into specific factors like location, size, and condition. While this method requires more data, it provides a detailed and precise view. Developers can access these granular insights through a real estate API to automate valuation models.
It’s also important to distinguish between nominal prices and inflation-adjusted prices (real prices). While nominal prices generally rise over time, real prices can reveal stagnation or even declines. For example, a home valued at $18,080.26 in January 1953 would equate to $220,769.49 today when adjusted for inflation.
These pricing tools are fundamental for understanding trends, but the level of data detail adds even more clarity.
Market Scope and Granularity
The scope and detail of data play a huge role in interpreting property value trends. The FHFA HPI, for example, covers all 50 states and over 400 cities, with data reaching back to the 1970s. This data is available at various levels, from national to census tracts.
"The FHFA HPI® incorporates tens of millions of home sales and offers insights about house price fluctuations at the national, census division, state, metro area, county, ZIP code, and census tract levels." – FHFA
Each level of detail offers its own insights. National trends capture large-scale cycles, such as the 2008 housing crash. In contrast, county-specific data highlights local nuances. For example, Nantucket County, MA, had a 2023 median home price of $2,512,654 – far above national averages. Some counties even experienced growth rates exceeding 627% over several years, trends that would remain hidden in broader analyses.
Property type is another critical factor. Single-family homes, condos, and multi-family units often follow different patterns of appreciation and volatility. Combining these categories can obscure important differences. Time resolution also matters: monthly data highlights seasonal fluctuations, while annual data smooths them out. Many indexes apply seasonal adjustments to remove recurring patterns, such as the spring buying surge, making it easier to identify underlying trends.
While data granularity is essential, understanding the broader forces shaping long-term trends is equally important.
Key Drivers of Long-Term Trends
Several factors influence long-term property values, including financing conditions, supply constraints, and shifts in demand. For instance, historically low interest rates between 2020 and 2022 caused annual home value growth to exceed 15%, effectively condensing years of appreciation into just two years. During this period, the national Zillow Home Value Index (ZHVI) median surged from about $126,143 in 2000 to a peak of roughly $377,362 by 2025.
The pandemic also reshaped demand. Remote work led to a surge in rural and suburban home purchases, driving up prices in areas that had previously seen little attention. States like Florida and Texas saw rapid growth as people migrated from high-cost coastal regions, drawn by lower taxes and more affordable housing.
Economic disruptions often lead to contrasting outcomes. The 2008 financial crisis caused prolonged depreciation in home values, while the COVID-19 pandemic triggered rapid price increases. As of February 2026, these compounded effects have created significant disparities: Hawaii’s median home price is around $823,970, while West Virginia’s median sits at just $169,780.
Data Sources for Analyzing Historical Property Values
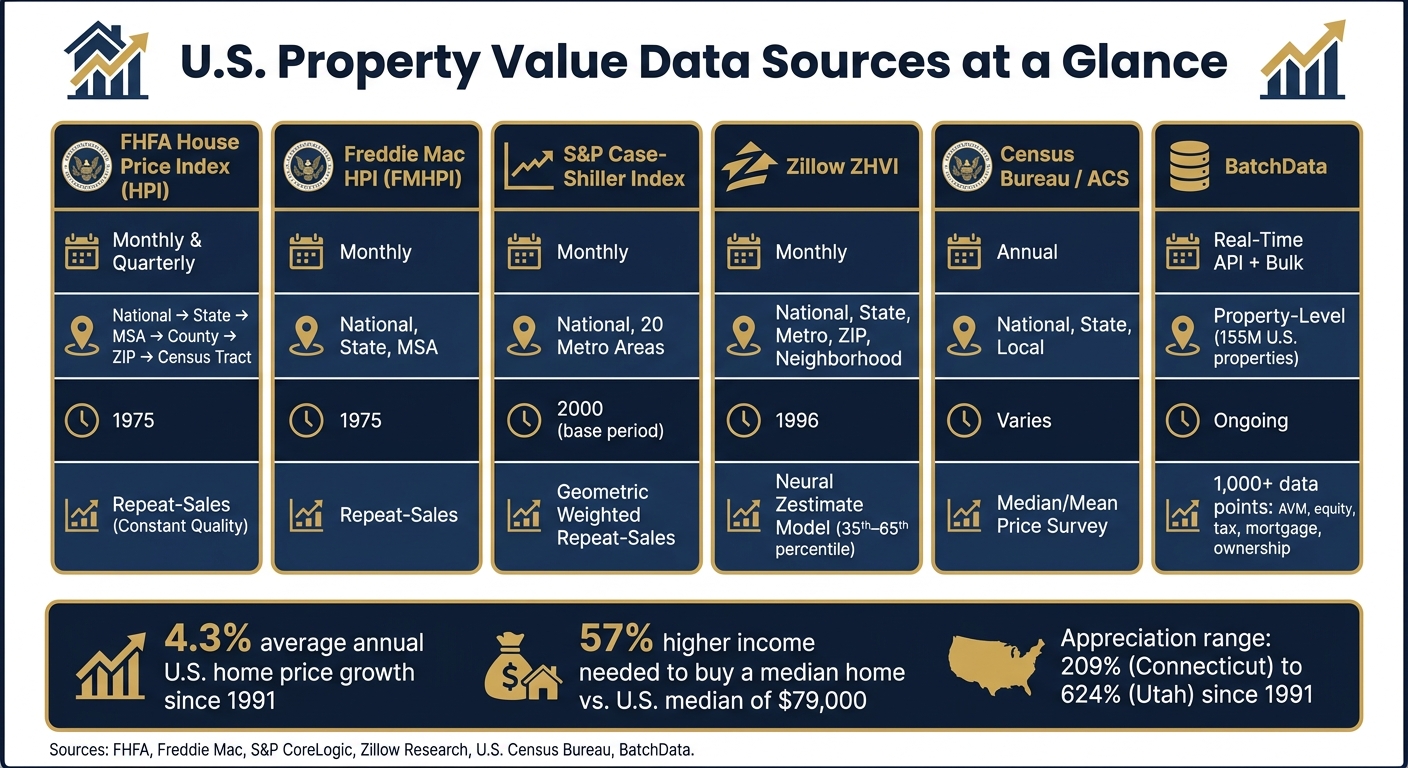
U.S. Property Value Data Sources Compared: FHFA, Freddie Mac, Case-Shiller & More
Knowing where property value data originates is just as crucial as understanding how to interpret it. The quality, scope, and methodology of each source play a key role in determining the reliability of any analysis.
Public and Government Data
The FHFA House Price Index (HPI®) is one of the most comprehensive government resources available. It pulls from tens of millions of home sales across all 50 states and over 400 cities, with records dating back to January 1975. By focusing on repeat-sales, it isolates actual price appreciation, excluding changes in property quality.
"The FHFA HPI® serves as a timely, accurate indicator of house price trends at various geographic levels. Because of the breadth of the sample, it provides more information than is available in other house price indexes." – FHFA
Similarly, the Freddie Mac House Price Index (FMHPI®) uses a repeat-sales approach to track price trends at the national, state, and metro levels, also starting in 1975. Both indexes report data in nominal terms, meaning adjustments for inflation require tools like the Bureau of Labor Statistics’ "All Items Less Shelter" series.
The U.S. Census Bureau and the American Community Survey (ACS) provide annual data on median and mean home prices. However, these figures also reflect changes in the physical characteristics of homes over time. Additionally, the Uniform Appraisal Dataset (UAD) Public Use File offers a 5% nationally representative sample of single-family mortgage appraisals, starting from 2013 for enterprise data and 2017 for FHA data.
| Data Source | Frequency | Geographic Granularity | Data Start |
|---|---|---|---|
| FHFA HPI | Monthly/Quarterly | National, State, MSA, County, ZIP, Tract | 1975 |
| Freddie Mac HPI | Monthly | National, State, MSA | 1975 |
| UAD Public Use File | Annual | National (5% sample) | 2013 (Enterprise) / 2017 (FHA) |
| Census Bureau (ACS) | Annual | National, State, Local | Varies |
While these government sources provide a strong foundation, private platforms can offer more detailed insights.
Industry and Research Platforms
Private platforms often fill in gaps left by public data, offering more granular and specialized information.
Zillow Research, for example, produces the Zillow Home Value Index (ZHVI), which tracks home values within the 35th to 65th percentile range, as well as indexes for the top and bottom market segments. Since January 2023, ZHVI has incorporated a neural Zestimate model for improved precision, while its ZORI index uses a weighted repeat-rent methodology.
The S&P CoreLogic Case-Shiller Index is another widely respected resource for metro-level price trends. Using a geometric weighted repeat-sales method, it tracks price changes with January 2000 as the base period. For instance, a national index value of 248 means home prices are 148% higher than they were in 2000. However, comparing this index with the FHFA HPI requires caution, as their base periods differ (2000 vs. 1991).
These platforms, while valuable, can be further enhanced with enriched data tools.
Data Enrichment and Integration Tools
To go beyond what public and private indexes provide, platforms like BatchData offer enriched datasets that explain not just what prices did but why they changed. BatchData integrates tax assessments, mortgage history, pre-foreclosure data, listing status, and ownership records into a single dataset covering 155 million U.S. properties with over 1,000 data points per property.
This depth of information provides insights into property-specific factors that drive value changes. For example, it can incorporate Automated Valuation Models (AVM), estimated equity, loan-to-value (LTV) ratios, and historical tax assessments. These tools help create a more detailed understanding of long-term value trends.
BatchData also offers flexible delivery options, including real-time APIs and bulk exports via Snowflake, S3, or flat files. This allows for both instant lookups and large-scale updates. As Chris Finck, Director of Product Management, explains:
"What used to take 30 minutes now takes 30 seconds. BatchData makes our platform superhuman." – Chris Finck, Director of Product Management
Such tools are especially useful when public indexes lack the granularity needed – for instance, when analyzing ownership trends in a specific ZIP code or identifying properties with high equity potential before they hit the market.
Methods for Analyzing Historical Property Value Trends
Understanding historical property trends requires choosing the right analytical methods to extract meaningful insights from the data.
Time Series and Index-Based Analysis
A popular tool in housing research is the repeat-sales methodology, which examines price movements by comparing multiple transactions of the same property over time. Both the FHFA HPI and Freddie Mac HPI rely on this approach.
"The repeat-sales procedure estimates price changes using repeat transactions on the same property units over time. This approach helps to control for differences in the quality of the houses… and is why we refer to the FHFA HPI® as a ‘constant quality’ index." – FHFA
The formula for calculating appreciation is simple: (Index Value 2 - Index Value 1) / Index Value 1. For instance, if an index rises from 200 to 248, the appreciation is 24%. However, keep in mind that recent data may undergo revisions, which can affect stability.
To account for seasonal fluctuations, like springtime buying surges, analysts often use the Census Bureau’s X-13 ARIMA seasonal adjustment procedure. This method removes recurring patterns that could skew month-over-month comparisons. For smaller areas, such as ZIP codes or census tracts, where sales data may be limited, using an "All-Transactions" index (which incorporates appraisal data from refinances) instead of a "Purchase-Only" index can improve reliability.
These methods provide a foundation for making adjustments based on broader economic factors.
Adjusting for Inflation and Affordability
After establishing index-based trends, it’s crucial to adjust for inflation to understand the real value changes. Analysts use the BLS "All Items Less Shelter" CPI series (BLS ID# CUUR0000SA0L2) to deflate nominal HPI values. Excluding the shelter component avoids circular reasoning, as housing costs are already part of the general CPI.
The formula for real appreciation is: ((Index_Current / Index_Prior) / (CPI_Current / CPI_Prior)) - 1. For example, a market showing 40% appreciation over a decade may look less impressive if inflation during that period was 35%. By combining this data with income levels or rental benchmarks, like the BLS owners’ equivalent rent, analysts can assess whether home values are outpacing what buyers can realistically afford.
Breaking down these trends further reveals more localized patterns.
Segmenting and Comparing Trends
National averages often hide substantial variations at the local level. For example, from 1991 to early 2026, appreciation ranged from 623.80% in Utah to 209.08% in Connecticut, highlighting a stark contrast that a single national figure would overlook. In Q1 2026, Reading, PA stood out with a one-year appreciation rate of 8.37% and a five-year growth rate of 62.71%, according to FHFA’s weighted repeat-sales analysis.
To dig deeper, analysts can segment data by geography (state, MSA, ZIP code, or census tract), property type, and price tier. Advanced tools like BatchData – Ivo Draginov enable detailed segmentation by layering property-specific details – such as ownership history, equity levels, and tax assessments – onto index trends. This approach allows analysts to go beyond "prices increased in this ZIP code" to identifying the specific property types and ownership profiles driving those changes.
| Analysis Method | Best For | Key Limitation |
|---|---|---|
| Repeat-Sales Index | Tracking pure price appreciation over time | Excludes properties sold only once; ignores renovations |
| Hedonic Price Model | Adjusting for size, age, and location differences | Requires large, granular datasets and regression modeling |
| Weighted Median | Regional Snapshot | Skewed by shifts in the mix of homes sold |
Applications of Historical Value Trends in Real Estate
Investment and Portfolio Strategy
Studying historical value trends provides a reliable way for investors to compare markets before making financial commitments. For example, a metro area with consistent 4%–6% annual growth and minimal downturns often presents a safer investment than one that experiences rapid growth followed by steep 50%+ declines. This was evident during the 2006–2012 housing bust, when national indexes dropped significantly.
Institutional investors in single-family rentals rely on ZIP-code and block-level historical data to pinpoint submarkets with steady appreciation and rent growth. Data from the Federal Housing Finance Agency (FHFA) reinforces this strategy. For instance, the five-year appreciation ending in Q4 2023 ranged from under 30% in some Midwestern states to over 60% in parts of the Sunbelt, highlighting significant regional differences that can impact portfolio returns. To refine acquisition strategies, investors should analyze 10–15 years of price and rent data – enough to cover at least one full market cycle – rather than focusing on short-term booms that might exaggerate sustainable gains. This approach also aids lenders in identifying potential risks tied to market vulnerabilities.
Lending and Risk Assessment
Historical trend analysis plays a key role in credit stress testing. Credit agencies like Fitch Ratings often incorporate home-price stress scenarios of −30% or more into their analyses of mortgages and residential mortgage-backed securities (RMBS), using the 2006–2012 downturn as a benchmark. For example, if a market experienced a 20% decline during the last recession and took five years to recover, lenders should model similar scenarios when stress-testing new loans. This ensures the borrower can maintain acceptable debt service coverage even under adverse conditions.
Stress testing should be tailored to specific market segments rather than applied broadly across a portfolio. For instance, the luxury condo market behaves differently from entry-level single-family housing. A practical measure used by lenders involves monitoring ZIP codes: if a price index for a specific area drops more than 10% in a single year, collateral in that region is flagged for reassessment. Historical data also helps differentiate between lasting market shifts and temporary price spikes, which directly influence loan-to-value (LTV) ratios and reserve requirements.
Scaling Operations with Data Enrichment
Historical trends, when paired with enriched data, can drive actionable strategies for real estate operations. For example, a company might use FHFA data to identify ZIP codes with strong five-year appreciation, then leverage tools like BatchData to enhance property records with owner contact details, equity estimates, and absentee-owner indicators. This turns market insights into targeted outreach opportunities. BatchData’s APIs streamline this process by automating property searches, filling in missing details, and verifying phone numbers at scale. Bulk data delivery further enables screening across thousands of properties simultaneously.
"The chain of title tells you who held the keys, but financial records tell you who held the power." – BatchData
Operators can combine trend data – such as ZIP-level appreciation and rent growth over 5–10 years – with enriched ownership information to develop sell-likelihood scores. These scores consider factors like how long an owner has held the property and their estimated equity. According to BatchData, using APIs and bulk data solutions can reduce property research and due diligence time by up to 70%. This efficiency makes it feasible to act on trend-based signals across entire markets rather than evaluating properties individually.
Conclusion
Understanding historical property trends is essential for making smarter investment choices, improving lending practices, and streamlining operations. Since market dynamics can shift significantly, timing and location remain key factors influencing property performance.
Public records may verify transactions, but they often lack insight into the broader market forces and equity distribution. That’s where enriched data becomes invaluable. As BatchData explains:
"Automation refines deep research, letting human expertise focus where it matters most."
Platforms like BatchData take fragmented records and transform them into comprehensive datasets. They enhance raw data by adding ownership history, equity estimates, and contact information, all while analyzing historical trends. This kind of enriched data empowers real estate professionals to make informed decisions – whether they’re stress-testing loan portfolios, spotting undervalued submarkets, or scaling acquisition strategies. By combining historical insights with enriched datasets, professionals can move beyond observing the market to taking decisive, impactful action.
FAQs
Which price metric should I trust most for long-term trends?
When analyzing long-term property value trends, the median home price stands out as the go-to metric. Why? It filters out the influence of extreme outliers, giving a much clearer picture of the market’s middle ground. Unlike averages, which can be heavily impacted by a handful of high-priced sales, median prices offer a more stable and reliable snapshot of typical property values. This makes them especially useful for tracking trends over time with greater accuracy.
How do I adjust home price growth for inflation correctly?
To understand home price growth accurately, it’s essential to adjust for inflation. Using inflation-adjusted prices rather than nominal prices reveals the actual growth by stripping out the effects of inflation. This approach ensures you’re looking at the real change in value over time. Monthly inflation-adjusted median home prices are a dependable way to measure the true growth of property values. By relying on this data, your analysis will account for inflation and provide a clearer view of historical trends.
How can BatchData help me analyze value trends at the property level?
BatchData offers a powerful way to track and analyze property value trends by delivering detailed, up-to-date information. This includes historical sales data, rental histories, and ownership records. With tools like Automated Valuation Models (AVMs), it helps users monitor market shifts and seasonal changes effectively. Plus, BatchData integrates datasets such as assessor records and mortgage transactions, giving a well-rounded view of the factors that influence property values. This comprehensive approach makes it easier to analyze trends and make smarter investment decisions.