
Automated data pipelines simplify real estate decision-making by transforming raw data into actionable insights in real time. These systems combine data from multiple sources like MLS listings, public records, and APIs, then clean, process, and store it for use in dashboards and analytics tools. The result? Faster, more accurate insights for brokers, investors, and property managers.
Key Takeaways:
- What They Do: Gather, clean, and process real estate data automatically.
- Why It Matters: Helps track trends like rent prices, vacancy rates, and property values.
- Core Components: Data ingestion, cleaning/enrichment, and storage management.
- Tools Used: BatchData APIs for property details, Apache Airflow for task automation, and Tableau/Power BI for visualization.
- Benefits: Eliminates manual work, ensures data accuracy, and delivers insights in under 20 minutes.
For real estate professionals, these pipelines are essential for staying ahead in a competitive market.
Real Estate End to End Data Engineering using AI
This video demonstrates how to build a robust architecture using comprehensive real estate datasets to power AI-driven insights.
sbb-itb-8058745
Core Components of Real Estate Data Pipelines
An effective real estate data pipeline brings together three key elements – data ingestion, cleaning and enrichment, and storage management – to transform raw data into actionable insights. These components work in harmony to track market trends, property values, and investment opportunities across various markets, ensuring data is processed efficiently and accurately.
Data Sources and Ingestion
The journey begins with data ingestion, where information flows in from multiple sources like MLS platforms, Zillow, Redfin, LoopNet, public tax records, and government databases. These inputs include everything from property listings and competitor pricing to vacancy rates and hyper-local metrics like rent per square foot. APIs, such as HouseCanary, enable access to over 75 data points per property, spanning details from individual neighborhoods to statewide trends.
To deliver reliable, real-time insights, pipelines must unify data from both proprietary and public sources. Bulk data pulls from APIs and real-time updates from listing platforms are essential for tracking key metrics like rental comparisons and vacancy rates. This ensures investors have the granular data needed to spot opportunities as they emerge. However, raw data alone isn’t sufficient – it needs to be standardized and enriched for deeper analysis.
Data Cleaning and Enrichment
Raw data often arrives riddled with inconsistencies, missing values, and duplicates. Data cleaning addresses these issues by normalizing and structuring information. This might involve standardizing addresses, eliminating duplicates, and filling in gaps to ensure the data is accurate and ready for analysis. Without this essential step, even the most advanced analytics tools can produce unreliable insights.
Beyond cleaning, data enrichment transforms basic information into a strategic asset. By leveraging AI-driven tools, enriched data can include forecasts, anomaly detection, and risk identification. Services like BatchData enhance raw records with verified phone numbers, ownership details, and property characteristics, turning simple listings into robust intelligence. This enriched data supports critical activities such as underwriting, marketing, and portfolio management.
Data Storage and Management
Once processed, data needs a secure and scalable home. Cloud-based databases have become the go-to solution, replacing outdated spreadsheets with systems capable of managing millions of records. These platforms are optimized for complex ETL processes, real-time API access, and handling data from diverse markets.
Modern storage systems also favor webhooks over constant polling. Instead of repeatedly querying for updates, webhooks push changes – like new liens, pre-foreclosure alerts, or price adjustments – directly to the system as they happen. This reduces system strain while ensuring dashboards and reports always reflect the latest data. Additionally, secure cloud storage ensures compliance with regulations, mitigating legal risks for professionals handling sensitive information.
Tools and Technologies for Building Automated Pipelines
Crafting an automated pipeline requires more than just solid data ingestion and storage – it’s about leveraging the right tools to automate workflows and visualize insights. These technologies work together to eliminate manual tasks, enabling real estate professionals to monitor market trends as they happen. APIs provide the raw data, orchestration tools streamline processes, and visualization platforms turn that data into actionable insights.
BatchData APIs for Real Estate Data
BatchData APIs form the backbone of automated pipelines by transforming manual data entry into real-time, structured property intelligence. With access to over 155 million property records and more than 700 attributes, these APIs allow users to filter data based on criteria like equity position or year built.
The Property Search endpoint acts as a powerful filter, scanning millions of records to match specific requirements. Meanwhile, the Contact Append (Skip Tracing) endpoint enriches property data with verified owner contact details – boasting an impressive 76% accuracy, tripling the industry standard. Additionally, the Property Details endpoint delivers comprehensive profiles, including AVMs, liens, mortgages, and transaction records, all in a structured JSON format. Responses arrive within milliseconds, making integration with platforms like Snowflake or BigQuery seamless.
"What used to take 30 minutes now takes 30 seconds. BatchData makes our platform superhuman."
- Chris Finck, Director of Product Management
BatchData also uses webhooks to send real-time notifications about changes in property status or new listings, reducing the need for constant API calls and cutting costs. For large-scale analytics, BatchData supports direct data delivery to cloud platforms like Snowflake, BigQuery, and Databricks, ensuring scalability and efficiency.
Data Workflow Orchestration Tools
Orchestration tools are essential for automating the scheduling, monitoring, and error handling of pipeline processes. Apache Airflow, for instance, uses Directed Acyclic Graphs (DAGs) to automate tasks like pulling MLS listings, cleaning records, and updating dashboards. This approach has proven effective – Real Estate Analytics used Apache Kafka with ClickHouse to streamline data flow, achieving query speeds 50× faster .
For a more modern, Python-native option, Prefect offers features like built-in error handling, retries, and dynamic task mapping. This makes it particularly useful for handling fluctuating data volumes from property listings. In one example, KBC Advisors utilized ArcGIS Data Pipelines to automate ETL processes, updating feature services in under 20 minutes daily while eliminating human errors. Both Airflow and Prefect also prioritize security, supporting encrypted data flows and role-based access to ensure compliance when managing sensitive property and owner information.
Once workflows are automated and secure, visualization tools take over to deliver insights in real time.
Visualization and Reporting Tools
After orchestration, visualization tools transform processed data into easy-to-digest insights. Tableau is a standout for creating interactive dashboards, mapping property trends, and generating heatmaps that highlight market shifts. On the other hand, Power BI integrates effortlessly with Microsoft tools, offering real-time reporting on metrics like rent per square foot or net operating income. Both tools can connect to data sources via APIs or direct queries, ensuring dashboards update automatically.
For example, Power BI can use enriched BatchData outputs to display vacancy rates and pricing trends, while Tableau can map geographic patterns of properties in pre-foreclosure . These tools make it easier for real estate professionals to identify opportunities and act on them quickly.
How to Build Automated Real Estate Data Pipelines
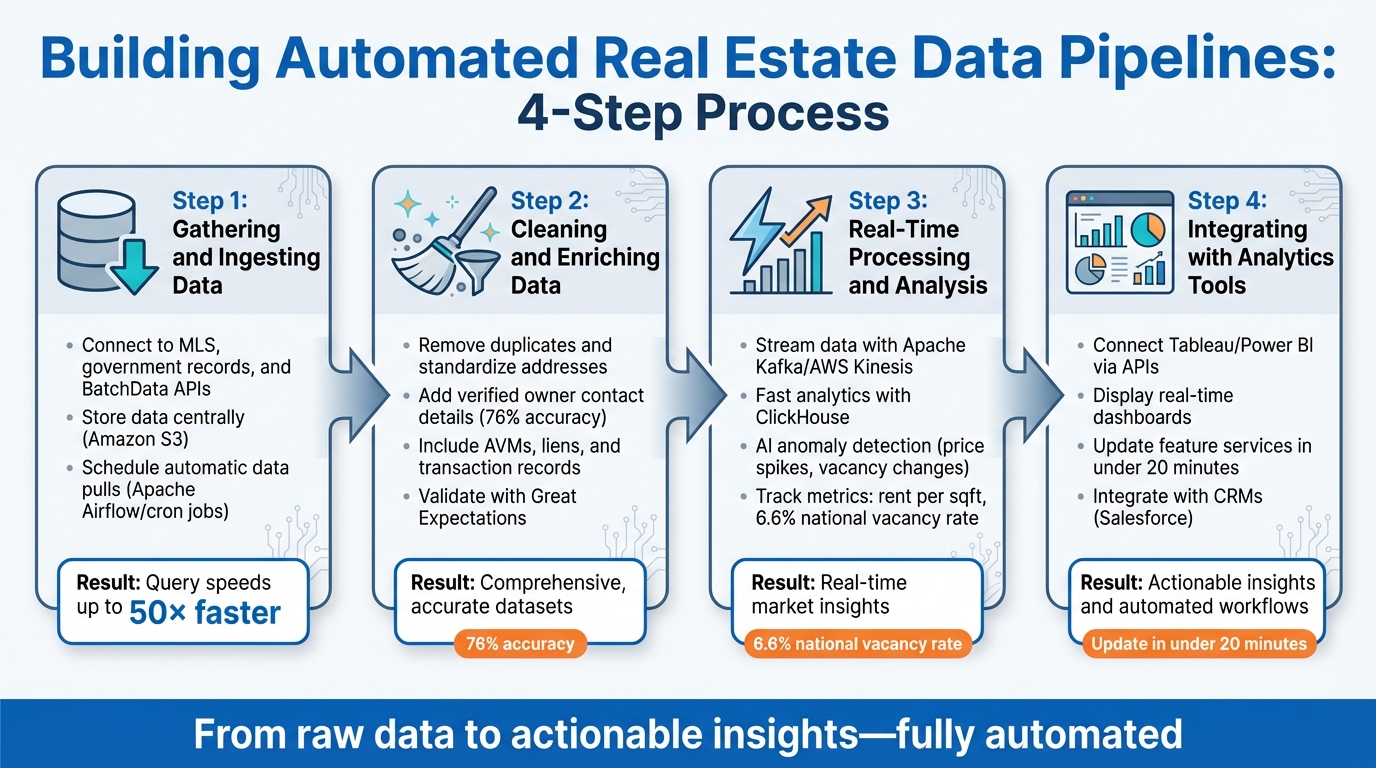
4-Step Process for Building Automated Real Estate Data Pipelines
Creating an automated real estate data pipeline involves connecting data sources, cleaning and processing records, and delivering insights to dashboards – all without manual effort. The objective is to turn raw property data into real-time, actionable intelligence. Let’s break it down step by step.
Step 1: Gathering and Ingesting Data
Start by identifying data sources like MLS, government records, and BatchData APIs. These serve as the foundation for your pipeline. Data ingestion involves fetching this information automatically and storing it centrally, such as in an Amazon S3 bucket.
For automation, BatchData APIs are a solid choice. Here’s a quick example using Python’s requests library to fetch property data:
import requests response = requests.get("https://batchdata.io/api/properties?zip=90210", headers={"Authorization": "Bearer YOUR_KEY"}) data = response.json() To keep this process running smoothly, schedule regular data pulls using tools like Apache Airflow or cron jobs. For web sources like Zillow or Redfin, consider using automation tools like Browse AI. A notable example: in 2023, Real Estate Analytics (REA) revamped their pipeline by pulling data directly into S3 and loading it into ClickHouse, skipping intermediate steps. This overhaul, led by Engineer Sam, resulted in query speeds up to 50× faster.
Once the data is ingested, it’s essential to clean and enrich it for accuracy and usability.
Step 2: Cleaning and Enriching Data
Cleaning raw data is crucial to eliminate inconsistencies and standardize information. Libraries like Pandas make this process straightforward. For instance:
df.drop_duplicates(subset=["address"]) You can also standardize addresses to USPS formats for consistency. To enrich your data, BatchData’s enrichment APIs are invaluable. For example, their Contact Append (Skip Tracing) endpoint can add verified owner contact details, while the Property Details endpoint provides additional insights like AVMs, liens, and transaction records. This allows you to transform basic MLS data into comprehensive datasets that include details like owner equity and distress flags.
To ensure your data meets quality standards, use validation tools like Great Expectations. These tools automatically check schemas and field accuracy. KBC Advisors, for instance, uses ArcGIS Data Pipelines to automate ETL processes multiple times daily. According to their GIS manager, Selena Lawson, this setup has significantly reduced manual errors.
Step 3: Real-Time Processing and Analysis
Real-time processing is where the magic happens. Tools like Apache Kafka or AWS Kinesis enable streaming data ingestion, while platforms like ClickHouse provide fast analytics. With these tools, you can track trends like market shifts, distressed properties, or undervalued assets as they emerge.
AI can further enhance this process. For example, scikit-learn’s isolation forests can detect anomalies, such as unusual price spikes or vacancy rate changes. You can also monitor key metrics like rent per square foot (e.g., $2.50 in NYC) or a 6.6% national vacancy rate in Q1 2026. A simple SQL query in ClickHouse might look like this:
SELECT avg(price/sqft) FROM properties WHERE date > '2026-01-01' GROUP BY zipcode This approach helps you stay on top of trends across different ZIP codes.
Step 4: Integrating Outputs with Analytics Tools
After processing the data, the next step is to integrate it with analytics platforms. Tools like Tableau and Power BI can turn your data into real-time dashboards. You can connect these platforms via APIs or direct queries. For example, use ClickHouse ODBC to link Power BI or export data to Tableau with a command like this:
clickhouse-client --query="SELECT * FROM trends" | tableau-exporter Set up routine updates to display key metrics, such as a 5% year-over-year price growth in Phoenix, AZ, or heatmaps of vacancy rates across markets. KBC Advisors, for instance, automated their pipeline to update feature services in under 20 minutes, multiple times a day. This reduced site survey deliverables from weeks to just one day. As GIS manager Selena Lawson noted, this system created hundreds of feature layers that reflect market changes in real time.
You can also integrate outputs with CRMs like Salesforce. This enables automated actions, such as triggering outreach based on alerts for distressed properties or tracking equity growth patterns.
Best Practices for Reliable and Scalable Pipelines
When managing data pipelines, reliability and scalability are essential, especially as data volumes and complexity grow. To achieve this, focus on three main areas: accuracy, performance, and compliance. Let’s break down how to apply these principles effectively.
Ensuring Data Accuracy and Consistency
Keeping your data accurate and consistent starts with continuous validation. Tools like Great Expectations or Apache Griffin can automate checks at every stage – whether it’s during ingestion, transformation, or output. For example, you can use schema validation to flag anomalies like unrealistically high property sales (e.g., over $10,000,000 in non-luxury markets) or enforce proper formats, such as US ZIP codes.
Set up rule-based validation to catch common errors. For instance, property age should stay within 0-200 years, and dates should follow the MM/DD/YYYY format. To go a step further, leverage AI-driven anomaly detection to identify outliers like unexpected rent spikes or changes in vacancy rates. Cross-checking data from multiple sources – such as Zillow and Redfin – can also help. If rent per square foot differs by more than 5-10%, it’s worth investigating.
Tracking data lineage is another must. It helps pinpoint the source of errors, making troubleshooting faster. Schedule daily validations and send alerts (via Slack or email) for any failures. To save time, statistical sampling – like reviewing 10% of daily ingested data – often identifies issues without bogging down the system. Normalize units early (e.g., standardizing square footage or currency formats) and version data with timestamps to minimize inconsistencies over time.
Optimizing for Performance and Scalability
As your data scales – whether you’re managing 10 properties or 1,000 – your pipeline must keep up. Using columnar storage formats like Apache Parquet can make querying large datasets more efficient. Partitioning data by factors like date or ZIP code can dramatically cut down query times.
For processing large datasets, distributed systems like Apache Spark are invaluable. For example, Spark can reduce ETL times for datasets over 1TB from hours to minutes. Serverless options such as AWS Lambda or Google Cloud Dataflow are excellent for handling spikes in data volume, such as during market events or quarterly reporting.
Keep an eye on pipeline performance metrics like throughput (aim for over 1,000 records per second), latency (under 5 minutes), and resource usage (stay below 80% CPU utilization). Tools like Prometheus can help monitor these metrics. Use orchestration platforms like Apache Airflow to dynamically adjust tasks, such as processing new ZIP codes as they’re added. This kind of horizontal scaling ensures your pipeline maintains high uptime – even when data volumes grow 100x.
Maintaining Compliance and Security
While scaling performance is critical, don’t overlook compliance and security. These measures protect your data pipeline’s integrity and keep you within legal boundaries.
For example, DNC compliance is non-negotiable. Violations can result in fines as high as $43,792 per incident in the US by 2026. To stay compliant, scrub contact data against national Do Not Call registries before outreach. Automate this process by integrating weekly TCPA/DNC list updates via APIs. Use fuzzy matching to achieve over 90% accuracy when scrubbing phone numbers and emails, and log all consents with timestamps. Services like BatchData’s phone verification tool can streamline this step.
For sensitive data like property ownership or financial details, use encryption – AES-256 for data at rest and TLS 1.3 for data in transit. Implement role-based access control (RBAC) with tools like AWS IAM, and secure API keys using secret management systems like HashiCorp Vault. To comply with GDPR and CCPA, tokenize owner data during processing and perform regular audits. Modular pipeline design can also help: validate data early, embed compliance checks post-enrichment, and monitor everything with tools like Datadog to track key metrics across accuracy, scalability, and compliance.
Conclusion
Automated data pipelines are changing the game, shifting the real estate industry from guesswork and gut feelings to decisions grounded in solid data and real-time insights. Whether you’re managing portfolios across multiple markets, sourcing deals as a broker, or spotting up-and-coming neighborhoods as a developer, these pipelines bring a level of speed and precision that manual workflows simply can’t match. This is a major step forward in how real estate analytics are being used.
Key Takeaways
The effectiveness of these pipelines comes down to three main stages: collection, processing, and delivery of actionable insights.
- Collection: This involves gathering data from sources like MLS listings, competitor pricing, and other public records.
- Processing: Here, the data is cleaned, structured, and enhanced using AI tools that add features like forecasting and normalization.
- Delivery: Finally, the refined insights are pushed to platforms you already use, such as Excel, CRM systems, or custom dashboards.
AI takes these pipelines to the next level by enabling features like dynamic pricing recommendations, churn predictions, and even identifying potential sellers before they list their properties.
BatchData simplifies this entire process by integrating, cleaning, and unifying data streams into one structured source. With daily updates and an API-first approach that ensures compliance, BatchData lets you focus on strategy. Tools like BatchRank, their machine learning model, even score properties based on their likelihood to sell – helping you prioritize leads more effectively.
Next Steps for Implementation
Ready to get started? Here’s a practical roadmap:
- Choose one challenge to tackle first, such as finding motivated sellers, validating property values, or benchmarking rents.
- Begin with collecting data from your most important sources.
- Implement basic analytics, and once you’re comfortable, layer in advanced AI forecasting.
- Gradually scale up as your team gains confidence in using the data.
You can also set up automated triggers for key events, like when properties enter pre-foreclosure or hit certain equity thresholds – giving you a head start on opportunities.
BatchData’s Pay-As-You-Go pricing makes it easy to dive in without committing to long-term contracts. For businesses with more complex needs, they offer custom datasets and professional services to help with data integration, enrichment, and implementation tailored to your portfolio. Visit batchdata.io to see how you can turn fragmented data into actionable insights that lead to smarter decisions, faster deals, and better returns.
FAQs
What data should I start with for a real estate pipeline?
To build a solid foundation in property data, begin with trustworthy sources like MLS feeds, public records, and APIs such as BatchData. These resources offer essential information, including property details, ownership records, sales history, and market trends.
BatchData stands out by providing access to over 155 million U.S. property records, along with verified contact details and economic indicators. This combination ensures higher-quality data, giving you the insights needed to make informed decisions.
How do I keep property and owner data accurate over time?
To keep property and owner data accurate, it’s essential to have a system for regular validation and upkeep. Start with completeness checks to spot any missing information, and make sure to cross-check your data against reliable sources like county records or public databases. Incorporating automation tools can simplify tasks like standardizing addresses or verifying contact details. Additionally, periodic updates and enriching your data can help maintain its accuracy and relevance over time.
How can I make my pipeline real-time without high costs?
To build a cost-effective real-time real estate data pipeline, leverage cloud-based tools and scalable APIs. Use platforms like AWS or Snowflake for efficient data processing, paired with automation tools such as Apache Airflow or AWS Glue to simplify workflows. Incorporating APIs like BatchData’s allows for instant property searches and enrichment, delivering updates in mere seconds. This setup reduces manual effort, keeps expenses under control, and ensures seamless real-time data processing.