




































If I need to know what a property is worth today, I use an AVM. If I need to know where a market may go in the next 3 to 12 months, I use AI trend models.
That’s the whole idea in one line.
Here’s the short version:
- AVMs estimate current property value
- AI trend models forecast future market direction
- AVMs lean on sales comps and property records
- AI models look at demand, inventory, rates, jobs, and other leading signals
- AVMs help with pricing, offers, and underwriting
- AI models help with market selection, acquisition pacing, and pipeline planning
- In fast-moving or thin-data markets, both tools can weaken if the data is stale or incomplete
A few numbers make the difference clear:
- Zillow reports about 2% median error for on-market homes and about 7.5% for off-market homes
- In some thin-data cases, AVM estimates can miss by 10% to 20% or more
- AI models can spot signals like 80% of new listings going pending, which may support pricing 3% to 5% above the last comp
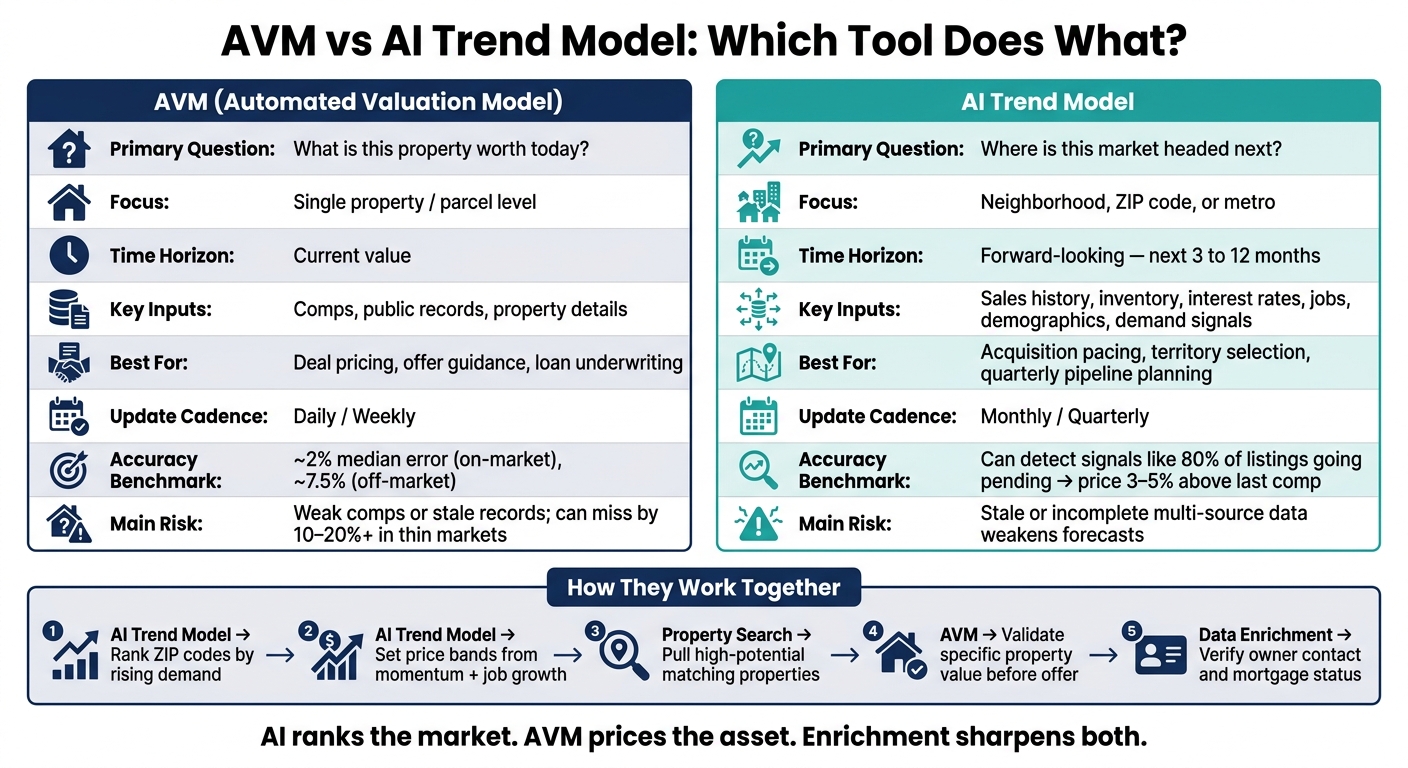
AVM vs AI Trend Model: Which Tool Does What in Real Estate?
AVMs & AI: What Real Estate Agents Must Know About Home Valuations
sbb-itb-8058745
Quick Comparison
| Criteria | AVM | AI Trend Model |
|---|---|---|
| Main question | What is this property worth now? | Where is this market headed next? |
| Focus | Single property | Neighborhood, ZIP code, or metro |
| Time frame | Current value | Next 3 to 12 months |
| Main inputs | Comps, public records, property details | Sales history, inventory, rates, jobs, demographics, local demand |
| Best for | Pricing assets | Planning where and when to buy |
| Main risk | Weak comps, stale records | Weak or missing multi-source data |
So when I look at AI vs AVM, I don’t treat it as an either-or choice. I see two tools doing two different jobs: one prices the asset, the other helps judge the market.
AVMs: Built for current property pricing
An automated valuation model (AVM) estimates parcel-level value from public records, comps, and property details in seconds. AVMs are used mostly in U.S. residential valuation, especially for single-family homes and small multifamily properties, where standard data is easier to find.
What AVMs predict well
AVMs work best when a property is fairly standard and the market has lots of data. In that setting, they do their best work on one job: producing a current estimate of what a property is worth.
Zillow’s Zestimate is one of the most visible AVM benchmarks. It reports a median error rate of about 2% for on-market homes and around 7.5% for off-market properties. Those numbers depend heavily on data depth and the quality of the comps.
Where AVMs fall short
AVMs tend to struggle in rural areas, low-volume submarkets, luxury or one-off properties, and fast-moving markets. The reason is pretty simple: the model doesn’t have enough recent, relevant comparable sales to ground the estimate.
That shows up in a few common ways. Rural counties may have only a small number of sales each year. Luxury homes often have no true comps. And in markets where prices are moving fast, closed-sale data can lag behind what’s happening on the ground. All of that can lead to a much wider error range.
AVMs also miss changes that haven’t made it into public records yet. So if a home just got a full kitchen remodel, the estimate usually won’t reflect it until the data does.
How teams use AVMs day to day
Even with those limits, AVMs are part of daily workflows across acquisitions, lending, brokerage, and portfolio management. Why? Because at the early stage, speed and scale matter a lot.
| Use Case | AVM Strength | Main Limitation | Business Impact |
|---|---|---|---|
| Acquisitions | Rapidly screens thousands of listings to find undervalued assets | May miss value from recent unrecorded renovations | Increases deal flow and speed to offer |
| Lending | Instant pre-qualification for low-risk products like home equity lines of credit (HELOCs) | Less accurate for high-value or unique luxury homes | Reduces loan approval timelines from weeks to days |
| Portfolio Review | Revalues entire portfolios for LTV risk management | Accuracy drops in rural areas with sparse sales data | Provides timely visibility into equity and risk exposure |
| Brokerage | Provides instant listing guidance and lead generation | Relies on lagging closed-sale data in fast-shifting markets | Enhances client engagement and sets pricing expectations |
API-driven AVMs make large-scale pricing checks routine in markets with strong data coverage. In harder-to-price areas, manual review still does the heavy lifting. And if the goal is to forecast where the market is headed, teams need a different kind of model.
AI trend models: Built for forecasting market direction
That forecasting layer is where AI trend models come into play. These models estimate where a market is headed over the next 3 to 12 months by looking at price growth, demand shifts, inventory, and transaction volume.
What AI models predict well
AI trend models are best at spotting shifts in demand, price movement, and absorption before those changes appear in closed sales. One clear example is absorption velocity – how fast similar inventory goes pending. If 80% of new listings in a given price band go pending, operators can often price 3% to 5% above the last comp.
They can also pick up buyer-search thresholds. These are demand clusters that form around specific search filters. In plain English, small pricing changes can have a big effect. Listing a home at $750,000 instead of $760,000 may put it in front of a much larger buyer pool, and that can sometimes spark bidding wars that drive the final sale price higher.
What AI models need to work
AI forecasts depend on complete, current data. If records are stale or property details are missing, the model gets weaker.
The main inputs usually include:
- Historical transactions
- Property attributes
- Neighborhood signals
- Interest rates
- Employment growth
- Demographics
- Local supply indicators
Top-performing models also use other data sources, such as satellite imagery, credit card transactions, and social media sentiment. BatchData can help support this layer through property enrichment, bulk delivery, and APIs that keep the dataset clean and up to date.
How operators use AI for planning
These forecasts help guide pricing, acquisition, staffing, and pipeline decisions.
| Forecast Type | AI Strength | Risk if Data Is Weak | Decision Supported |
|---|---|---|---|
| Absorption Velocity | Predicts how fast inventory will move in a specific market segment | Stagnant listings and chasing the market down | Pricing strategy and marketing budget allocation |
| Inventory Pressure | Tracks inflow vs. outflow across competitive cells | Missing a market slowdown; holding assets too long | Acquisition volume and pipeline planning |
| Transaction Volume | Predicts market turning points using high-frequency indicators | Inaccurate staffing and outreach volume forecasts | Staffing, outreach, and operational scaling |
| Future Supply | Uses satellite imagery to track development stages | Miscalculating future supply pressure | Staffing levels and outreach volume planning |
The output still needs human judgment, especially when the model and the market diverge. From there, the direct comparison comes down to price, trend, speed, and data needs.
AI vs AVM: Direct comparison for decision-makers
These tools solve different kinds of decisions.
An AVM answers, "What is this property worth today?" An AI trend model answers, "Where is this market moving next?" That difference matters because the best tool depends on the workflow.
Parcel value vs market trend
AVMs work at the individual asset level. They estimate the current value of a specific parcel.
AI trend models work at a broader level – neighborhoods, ZIP codes, or entire metros. Their job is to spot market momentum shifts before those changes show up in closed sales.
That split makes the use cases pretty clear:
- AVMs fit deal pricing, offer guidance, and loan underwriting
- AI trend models fit acquisition pacing, territory selection, and quarterly pipeline planning
Speed, accuracy, and data dependency
AVMs are often updated daily or weekly as new sales hit the record. Their logic is usually easier to audit because property-level adjustments – like bedrooms, square footage, and condition – are visible and easier to trace.
The downside is simple: an AVM is only as good as its comps. In rural markets or with unusual properties, accuracy can drift. In some cases, AVM estimates can land 10–20% or more away from the actual sale price.
AI trend models rely on multi-layer datasets. That can include economic data, demographic shifts, inventory velocity, and sometimes satellite imagery or sentiment signals.
That extra depth helps with forecasting. But there’s a catch. These models need strict statistical validation before teams use them to steer long-range planning.
Which method fits which workflow
AVMs support pricing; AI supports planning. The table below shows where each method fits best.
| Dimension | AVM | AI Trend Model |
|---|---|---|
| Primary Question | What is this property worth today? | Where is this market moving next? |
| Granularity | Parcel / Individual asset | Neighborhood / ZIP code / Metro |
| Time Horizon | Current | Forward-looking (Forecast) |
| Data Dependency | Property-level data | Multi-source macro and behavioral data |
| Interpretability | High – rule-based, auditable | Moderate – requires statistical validation |
| Update Cadence | Daily / Weekly | Monthly / Quarterly |
| Best Use Case | Deal pricing, offer guidance, loan underwriting | Quarterly strategy, territory selection |
| Validation Metric | Median absolute percentage error | Directional accuracy |
Most teams lean on AVMs for pricing and use AI to help with timing.
How teams combine AI and AVMs for pricing and pipeline decisions
The comparison starts to matter when teams use both tools in one workflow.
A layered workflow for acquisitions and pricing
Use AI to rank markets, then use AVMs to price individual assets.
First, AI trend models rank ZIP codes and MSAs using leading indicators to spot markets where demand is rising. That cuts down the list to places worth chasing. From there, teams set price bands based on neighborhood momentum and job growth, not just historical comps.
Once the team confirms a target market, AVMs take over at the asset level. Before an offer goes out, the team pulls a current valuation for the specific property to see if the price fits inside the band. That two-step flow keeps acquisitions grounded at both levels: the market view and the property view.
| Workflow Step | Tool | Action |
|---|---|---|
| 1. Market Ranking | AI Trend Model | Identify ZIP codes with rising demand and tightening inventory |
| 2. Price Band Setting | AI Trend Model | Set target price bands from neighborhood momentum and job growth |
| 3. Property Search | Property search | Pull high-potential properties matching the target criteria |
| 4. Asset Pricing | AVM | Validate a specific property’s value before the offer |
| 5. Verification | Data Enrichment | Verify owner contact info and mortgage status before outreach |
That flow turns broad market signals into property-level offers. AI scoring helps at the top of the funnel, and AVM pricing helps before the bid goes out.
The role of data pipelines and enrichment
Both AI models and AVMs work better when the underlying data is clean, current, and complete. Stale ownership records, missing mortgage data, and incomplete property details can weaken both models.
BatchData supports this layer with property search APIs, bulk delivery, contact enrichment, phone verification, and integration services. When property details, financial records, and owner contact data are enriched and verified early, both the AI ranking and the AVM output become more dependable. That leads to better pricing, fewer bad leads, and faster offers. Teams treat enrichment as part of the workflow, not as a cleanup step.
Use AI to rank markets and AVMs to price assets. One guides timing. The other checks value. AI ranks the market, AVMs verify the asset, and enrichment sharpens both.
FAQs
When should I use AI instead of an AVM?
Use AI models when you need fast analysis across large datasets or want to spot new market trends. They can assess hundreds of variables, which makes them a strong fit for 3-to-12-month forecasting.
For high-value, one-of-a-kind, or more complex properties, lean on human expertise or standard appraisals. In those cases, local context and the property’s condition can have a big effect on the final valuation.
Can AI trend models predict individual property values?
Yes. AI-powered automated valuation models (AVMs) can estimate the value of a single property by analyzing 1,000+ attributes. That includes property details, neighborhood trends, and real-time market data.
In many active markets, AVMs are often quite accurate, with median error rates ranging from 2% to 10%. Still, they’re not perfect. Think of them as an objective tool, not the final word.
They tend to work best when used alongside human judgment.
How do I combine AI and AVMs in one workflow?
Start by pulling clean, structured property data through real-time APIs. Then layer in AVM outputs so you can turn raw records into metrics your team can act on, like loan-to-value ratios.
Next, pass that enriched data into AI models built for specific predictions, such as seller likelihood. From there, send the results into your CRM or internal systems so teams can view real-time valuations, lead scores, and property profiles in one place.
That setup matters because it cuts down on guesswork. Instead of bouncing between tools or piecing data together by hand, your team gets a live picture of both the property and the opportunity tied to it.


