
A property can look good on its own and still hurt your portfolio. That’s the main point: AI helps me test each asset against the full mix of markets, debt, cash flow, and timing risk before I buy, hold, sell, or refinance.
Here’s the short version:
- I use rent, vacancy, expenses, taxes, values, and loan terms to forecast cash flow and returns.
- I check portfolio concentration by market, property type, and debt maturity, not just single-asset performance.
- I turn model output into plain actions: buy, hold, sell, or refinance.
- I stress test downside cases like higher rates, lower rent growth, rising vacancy, and cap rate expansion.
- I keep the data clean and consistent so metrics like NOI, DSCR, LTV, and IRR mean the same thing across every asset.
A few numbers show why this matters. The article notes about $875 billion in 2026 CRE and multifamily debt maturities, plus $652 billion in 2027. If too many loans come due at once, even decent assets can face pressure.
What I take from this is simple: AI works best when it ranks assets in portfolio context, flags weak spots early, and ties every score to a clear decision rule.
| Focus area | What I look at | What it helps me decide |
|---|---|---|
| Property performance | Rent, occupancy, expenses, NOI | Buy or hold |
| Debt risk | DSCR, LTV, maturity dates, covenants | Refinance or sell |
| Portfolio mix | Market exposure, asset type mix, rollover concentration | Rebalance |
| Downside risk | Rate shocks, vacancy stress, cap rate changes | Protect cash flow and liquidity |
| Data quality | Standard rent rolls, owner records, loan files | Whether I can trust the model |
If I had to sum up the full article in one line, it would be this: AI portfolio optimization is less about finding the “best” property and more about building a portfolio that can hold up under pressure.
Global Real Estate Outlook 2026: How AI Is Reshaping Real Estate Strategy | JLL
sbb-itb-8058745
The Data That Powers AI Real Estate Portfolio Models
Portfolio models usually rest on three data layers: operating performance, balance-sheet risk, and ownership signals. Each one gives AI models a different view of return, risk, and how a property fits the rest of the portfolio. The next three blocks walk through operating data, balance-sheet data, and owner data.
Property, Income, Expense, and Vacancy Inputs
The starting point for almost every portfolio model is the rent roll. If the rent roll is weak, the model is shaky from the start.
A usable rent roll should include unit identifiers, current monthly rent in USD, lease start and end dates in MM/DD/YYYY format, renewal options, concessions booked as negative line items, such as one free month, and delinquency status. Operating expenses like utilities, repairs and maintenance, property management fees, insurance, marketing, payroll, and property taxes should be coded to one chart of accounts and tagged by period, such as monthly or annual.
From there, teams calculate the metrics that feed AI models. Gross Potential Rent (GPR) is market rent per unit multiplied by total rentable units at full occupancy. Effective Gross Income (EGI) takes GPR, subtracts vacancy loss, concession loss, and bad debt, then adds other income. NOI equals EGI minus operating expenses, excluding debt service, depreciation, and income taxes.
Physical occupancy tells you how much space is filled. Economic occupancy tells you how much rent is actually coming in. That difference matters. Economic occupancy picks up concessions, non-paying tenants, and below-market leases that a simple occupied-versus-vacant count can miss. Institutional lenders also underwrite a minimum vacancy floor of 5% even for fully occupied assets to account for normal turnover risk.
Value, Tax, Debt, and Refinance Inputs
These inputs turn raw operating performance into hold, sale, and refinance estimates.
Valuation fields matter for both hold-period analysis and exit modeling. Automated valuation models (AVMs) use recent sales comparables, property type, square footage, year built, renovation status, location attributes, and current NOI. Teams pair those inputs with market cap rate assumptions to estimate current value and exit value across different scenarios. Market data, including comparable rents, occupancy trends, cap rates, and new construction pipeline, helps shape rent growth and value forecasts.
Tax data plays a big role too. Assessed value, local tax rates, exemptions, historical appeals, and scheduled reassessments feed property tax expense forecasts and give teams a clearer read on jurisdictional risk.
Debt data needs to be complete at the loan level. For each asset, that means current balance in USD, interest rate fixed or floating with index and spread, amortization type, monthly debt service, maturity date, covenant terms, and prepayment penalties such as yield maintenance, defeasance, or step-down schedules. AI models use this data to calculate DSCR and LTV over time.
A common screen for refinance candidates looks at lender thresholds such as:
- 1.20×–1.35× DSCR
- 65%–75% LTV
If covenant data is missing, refinance capacity can look better on paper than it actually is.
Owner and Enriched Property Data for Stronger Signals
Owner records add motivation signals that operating data by itself can’t show.
Ownership tenure, estimated equity, lien history, transaction history, portfolio size, and distress markers such as foreclosure filings or code violations all help models estimate which owners may be more likely to sell, refinance, or need capital. If contact data is old, those owner-level signals get weaker and outreach slows down. BatchData – Ivo Draginov provides property and contact enrichment, skip tracing, phone verification, property search APIs, and bulk data delivery to keep owner records current.
Once owner records are enriched and joined with operating and debt data, AI models can shift from reactive deal review to proactive portfolio strategy. That means ranking high-equity, long-tenure owners, flagging distressed assets before they hit the market, and prioritizing outreach to owners whose financing profiles point to near-term motivation and stronger portfolio decision signals.
How AI Models Forecast Returns, Risk, and Portfolio Fit
Forecasting Rent, Value, Costs, and Cash Flow
Once the data is clean and connected, AI models start estimating performance at the property, submarket, and portfolio levels. And portfolio fit is about more than a property’s stand-alone return. It also looks at diversification across geography and property type, capital efficiency, and liquidity.
At the property level, time-series models plus gradient boosting and random forest models are used to forecast rent and vacancy. Operating cost forecasts tie each line item to CPI, local wage indexes, and energy prices. Tax forecasts rely on jurisdiction-level reassessment patterns. Value forecasts blend NOI, exit cap rates, and comparable-sales checks.
Those property-level forecasts then feed into hold-period cash flow models. For a typical 5–10 year hold, the model projects gross potential rent, subtracts vacancy and credit loss, deducts operating expenses and property taxes, and reaches NOI year by year. Then it applies debt service to test DSCR in each period and calculates IRR and equity multiple from the projected cash flows. In the terminal year, NOI is divided by an exit cap rate assumption to estimate sale proceeds, net of selling costs and the remaining loan balance. The model then calculates IRR and equity multiple under base, upside, and downside cases.
Those forecasts become the inputs for portfolio ranking, stress testing, and allocation rules.
Optimization Methods and Scenario Testing
Once property-level forecasts are ready, portfolio-level optimization methods help decide how assets should be weighted, ranked, or repositioned against each other. In real estate, that process also has to account for concentration limits, leverage caps, and the fact that these assets are illiquid.
| Method | Main Inputs | Outputs | Best-Fit Use Cases |
|---|---|---|---|
| Mean-variance optimization | Expected returns, return covariance across markets and asset types, risk aversion, leverage | Portfolio weights by asset, market, or strategy; efficient frontier | Allocation across geographies and property types; long-term capital deployment |
| Constraint-based ranking | IRR, equity multiple, DSCR, yield-on-cost, risk scores, leverage and geographic limits | Ranked buy/hold/sell/refinance list; committee shortlists | Day-to-day asset management, deal selection, disposition prioritization |
| Scenario analysis | Base underwriting plus shocks to rent, vacancy, cap rates, expenses, interest rates | NOI, DSCR, value, IRR, and equity multiple under each scenario | Stress testing for rate hikes, recession, or local oversupply; lender and investor reporting |
| Sensitivity testing | Key drivers varied one at a time: rent growth, exit cap rate, lease-up speed, construction cost | IRR and equity multiple sensitivity; tornado charts | Pre-investment underwriting; finding which assumptions have the biggest effect by debt maturity and leverage |
| Monte Carlo simulation | Distributions for rent growth, vacancy, cap rates, expense inflation, interest rates; cross-market correlations | Probability distributions for IRR, equity multiple, DSCR, portfolio value; tail-risk measures | Portfolio-level risk review; institutional reporting; sizing capital buffers |
Research on balanced portfolios shows that segment and geographic diversification, along with LTV at or below 50%–60%, can lead to roughly half the downside of more levered, concentrated portfolios under stress scenarios.
From Model Scores to Decision Signals
The last step is turning model scores into decisions. A score has no value on its own if it doesn’t change what someone does next. Put simply, scores matter only when they connect to a decision rule.
Well-built AI systems convert model outputs into five types of decision signals:
- Rankings sort assets by risk-adjusted return, while staying within policy constraints, so acquisition and retention lists can be prioritized for review.
- Risk flags appear when a metric crosses policy limits.
- Concentration alerts track exposure by MSA, state, asset type, and tenant industry. If a single metro goes past a policy threshold, the alert pushes a disposition or diversification discussion.
- Refinance triggers watch interest rate curves, loan covenants, and property performance to flag windows where refinancing could cut debt service or free up equity.
- Hold-vs-sell breakpoints compare hold IRR with sale-and-redeploy IRR. If sale-and-redeploy IRR is higher, the asset is flagged for disposition review.
Each signal also needs a plain-English rationale, a link back to the underlying assumptions, and a documented threshold. That way, asset managers, investment committees, and operations teams can review, challenge, and record decisions for buy, hold, sell, and refinance actions, as well as for compliance and audit purposes.
Using AI Outputs for Buy, Hold, Sell, and Refinance Decisions
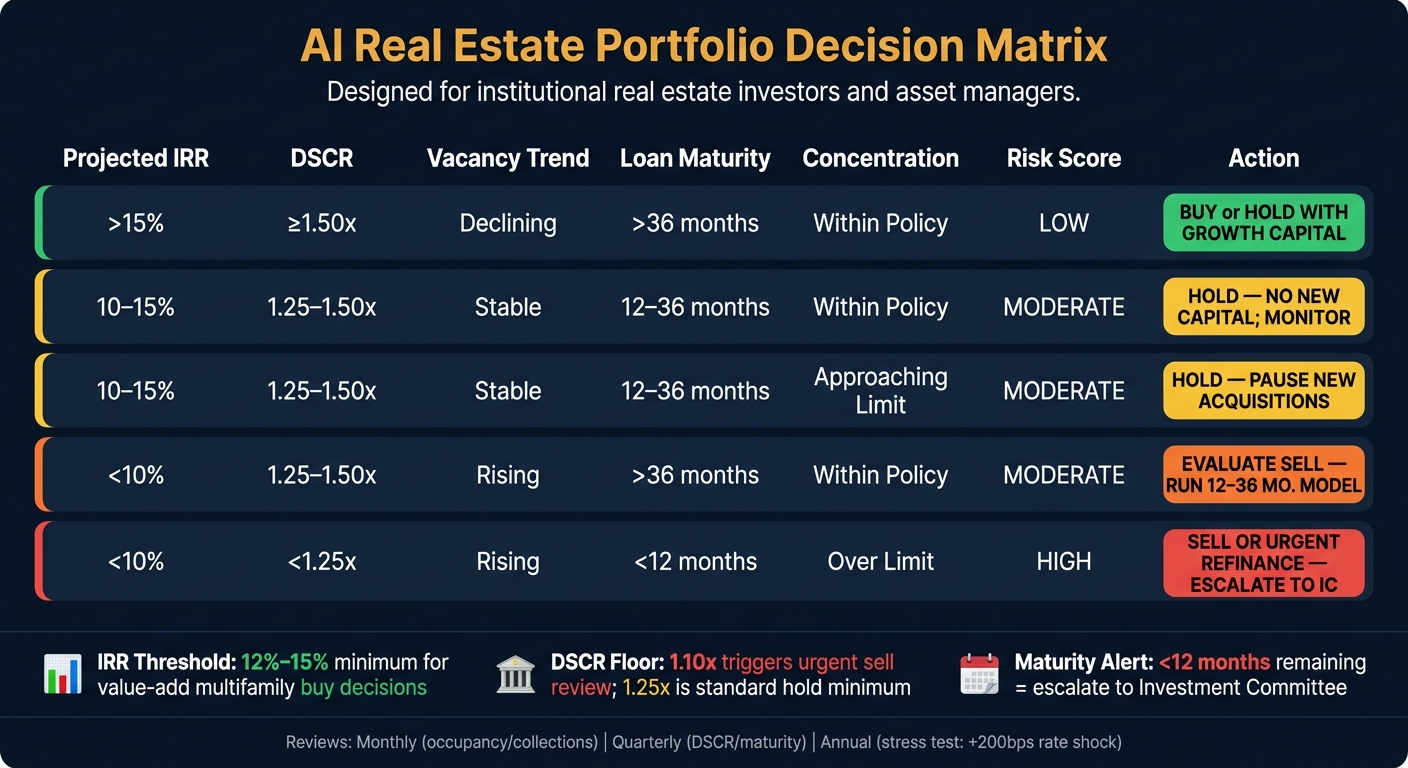
AI Real Estate Portfolio Decision Matrix: Buy, Hold, Sell, or Refinance
The forecasts from the previous section turn into decision rules here. Teams use them to set clear thresholds for buy, hold, sell, and refinance calls.
Buy and Hold Decisions Based on Risk-Adjusted Return
For buy decisions, institutional teams usually set thresholds before a property ever reaches the investment committee. In value-add multifamily, a common bar is a modeled 5-year levered IRR above 12% to 15%, with downside cases still keeping DSCR at or above 1.25x and LTV within policy limits. Teams also compare in-place yield with modeled exit cap rates. A spread of about 75 to 100 basis points can give some cushion if cap rates move up by the time of sale.
Owner signals add another layer. Absentee ownership, tax delinquency, liens, and unusual entity structures can all help flag both acquisition targets and risk. Enriched property and contact data from BatchData can surface those signals and cut long target lists down to the properties that match return and risk goals.
Hold decisions lean on projected return on equity, not just current cash flow. A property can look fine on the surface and still drift into a weaker position. Say AI forecasts show flat NOI growth, but capital needs are climbing, like a roof replacement in year 4, while a property tax reassessment is also on the way. In that case, the model may show a falling risk-adjusted return even if day-to-day operations still look steady.
Lease rollover exposure also matters. Heavy rollover during a weak absorption period can move a property from hold to monitor closely or even prepare for sale. Teams also apply concentration limits by state, metro, and property type so they don’t put too much capital into risks that may move together.
Sell and Refinance Decisions Based on Timing and Capital Structure
AI sell analysis compares the NPV of selling now with holding for 12, 24, 36, or 60 months under base, upside, and downside cases for rent, expenses, cap rates, and interest rates. If a 36-month hold only lifts expected IRR from 11% to 12% but adds lease rollover risk and interest-rate uncertainty, the model may lean toward a near-term sale.
The downside case usually carries the most weight. If stress testing shows DSCR falling below 1.10x, or a major capex event hitting in the same year as lease rollover, the model may point to a sale within 12 months to protect equity and free up capital for better uses.
For refinance decisions, AI models take in the loan coupon, amortization, interest-only periods, rate reset dates, maturities, covenants, extension options, and prepayment penalties. Then they simulate debt service under forward rate curves. A floating-rate bridge loan on a transitional asset may show pressure at reset. A refinance into a fixed-rate structure, on the other hand, can improve DSCR from 1.20x to 1.50x, lower maturity concentration, and produce net-positive cash-out that can be redeployed. Teams usually run these reviews quarterly and escalate loans that are nearing maturity or facing covenant pressure to the investment committee.
Decision Matrix for Investment Committees and Asset Managers
To keep decisions consistent across teams, firms often put these rules into a simple action matrix. The rules are built right into dashboards so properties fall into action buckets automatically, which gives investment committees and asset managers one shared framework for action.
| Projected IRR | DSCR | Vacancy Trend | Loan Maturity | Concentration Exposure | Portfolio Risk Score | Recommended Action |
|---|---|---|---|---|---|---|
| >15% | ≥1.50x | Declining | >36 months | Within policy | Low | Buy or hold with growth capital |
| 10–15% | 1.25–1.50x | Stable | 12–36 months | Within policy | Moderate | Hold; no new capital; monitor |
| 10–15% | 1.25–1.50x | Stable | 12–36 months | Approaching limit | Moderate | Hold; pause new acquisitions in this market |
| <10% | 1.25–1.50x | Rising | >36 months | Within policy | Moderate | Evaluate sell; run 12–36 month hold-vs-sell model |
| <10% | <1.25x | Rising | <12 months | Over limit | High | Sell or urgent refinance; escalate to IC |
Monthly asset reviews center on occupancy, rent collections, and budget variances. AI dashboards flag any property where occupancy drops below 90% or DSCR moves toward 1.20x, which gives teams a cue to respond right away.
Quarterly portfolio rebalancing looks at weighted-average DSCR, maturity concentration, and updated IRR distributions across the full portfolio. That helps teams spot over- or under-weight positions and trigger disposition or refinance mandates.
Annual business-plan resets bring in full AI reforecasts with revised macro and interest-rate assumptions. At that stage, investment committees also run stress tests, such as a 200-basis-point rate shock or a recession case, to check that planned actions still preserve acceptable downside protection and liquidity across the portfolio.
Building a Data and AI Workflow for Real Estate Teams
Data Infrastructure, Governance, and KPI Standardization
After forecasting and decision rules are in place, the next job is operational control. That’s what turns model signals into something a real estate team can use across an entire portfolio.
Once models start producing rankings and decision signals, teams need a governed data layer that keeps forecasts and actions in sync. In practice, that means pulling rent rolls, accounting ledgers, tax records, debt schedules, valuation files, and ownership registries into one cloud warehouse. Scheduled ETL/ELT pipelines should handle conflicts by assigning a clear system of record for each data type.
For U.S. portfolios, field formats should match local standards:
- Dollar amounts in USD
- Dates in MM/DD/YYYY format
- Square footage in square feet
- Loan terms in annual interest rates and remaining months
Use role-based access controls and a data catalog so each team works from the same governed warehouse with the right permissions.
Before any model runs, teams also need a written metric definition sheet. Define NOI, occupancy, DSCR, debt yield, and cap rate once. Then bake those formulas into warehouse logic so every dashboard uses the same definitions. That step matters more than it may seem. Even small formula changes can shift rankings, thresholds, and committee decisions.
Governance isn’t optional here. Each model should have clear documentation for its purpose, inputs, training window, and performance. Every assumption change should be logged with the date, source, and approver. Any buy, hold, sell, or refinance action should require human approval, with asset managers signing off and documenting overrides when they happen. Audit logs should also show when each model run happened, which model version and assumptions were used, and what decisions followed.
A Phased Rollout Plan from Data Cleanup to Optimization
Skip the big-bang rollout. A phased approach gives teams room to clean up data first, add missing fields next, and then move into forecasting and optimization without making a mess.
| Phase | Focus | Key Milestone |
|---|---|---|
| 1. Data cleanup | Consolidate and standardize source data; harmonize property IDs, clean rent rolls, and implement basic validation checks | Single source of truth for active assets |
| 2. Data enrichment | Fill missing property attributes, owner records, and contact fields using external enrichment | Reduced manual research; higher model input coverage |
| 3. Forecasting dashboards | Standardized dashboards with current KPIs and 3–10-year rent, NOI, DSCR, and cash-flow forecasts by property and portfolio | Investment committee has a consistent forward-looking view |
| 4. Scenario testing | Interest rate shocks, tax reassessments, vacancy stress tests, and cap rate expansion | Teams can model downside cases on demand |
| 5. Optimization and reporting | Buy, hold, sell, and refinance recommendations with auditable outputs | Committee-ready reports linked to versioned runs |
Phase 2 is where enriched property and contact data starts pulling its weight. Missing ownership and contact records hurt both model inputs and follow-through. BatchData – Ivo Draginov can help fill missing ownership, unit, and contact fields through enrichment, skip tracing, phone verification, and bulk delivery. Teams should keep the original raw data for audit purposes, tag enriched records with source and timestamp, and flag anything that conflicts with verified legal documents.
Conclusion: The Inputs, Models, and Decisions That Matter Most
At that stage, the workflow holds up only if the data, model, and approval layers stay aligned. Strong AI portfolio optimization depends on three parts working together: reliable inputs – rent, value, tax, debt, vacancy, and owner data – give models an accurate view of each asset; forecasting and optimization models turn those inputs into cash-flow projections, risk scores, and liquidity signals; and structured decision workflows turn model output into consistent buy, hold, sell, and refinance actions that investment committees can review, approve, and audit.
Teams that get this right treat data infrastructure and governance as the base layer. Clean, enriched, well-governed data leads to outputs teams trust – and those are the outputs people actually use.
FAQs
How does AI judge portfolio fit?
AI judges portfolio fit by measuring risk and modeling performance against your investment goals. It runs predictive algorithms and what-if scenarios – like interest rate hikes or economic downturns – to see how stable a portfolio may be under pressure.
Using real-time data such as rent rolls, tax assessments, debt, and vacancy rates, it checks whether an asset meets target returns. It can also help flag the best next move: buy, hold, sell, or refinance.
What data matters most for accurate forecasts?
Accurate real estate forecasts start with good data from a few different angles.
That usually includes property details, financial records, and performance numbers like rental income, vacancy rates, maintenance costs, and net operating income.
But that’s only part of the picture. Models also need market trends, demographic shifts, economic signals like interest rates, and owner behavior data. Put together, these inputs help support decisions around buying, holding, selling, and refinancing.
When should a property be sold or refinanced?
Sell or refinance decisions should be driven by the numbers. The main things to look at are equity, loan-to-value (LTV), and the property’s overall performance.
Refinancing can make sense when the property value goes up or when market conditions give you more room to improve cash flow and financing terms. Selling may be the better move when the property starts showing early financial trouble, like pre-foreclosure signs, or when it consistently misses key performance targets.