Event-driven analytics transforms how property market data is analyzed by delivering real-time insights instead of delayed, retrospective reports. This approach processes events like price changes, new listings, or foreclosure notices as they happen, enabling faster, more informed decisions. Here’s why it matters and how it works:
- Real-Time Data: Tracks events like price cuts, building permits, or distress filings instantly, instead of waiting for monthly or quarterly reports.
- Actionable Triggers: Alerts based on specific events (e.g., tax liens, ownership changes) help identify opportunities early.
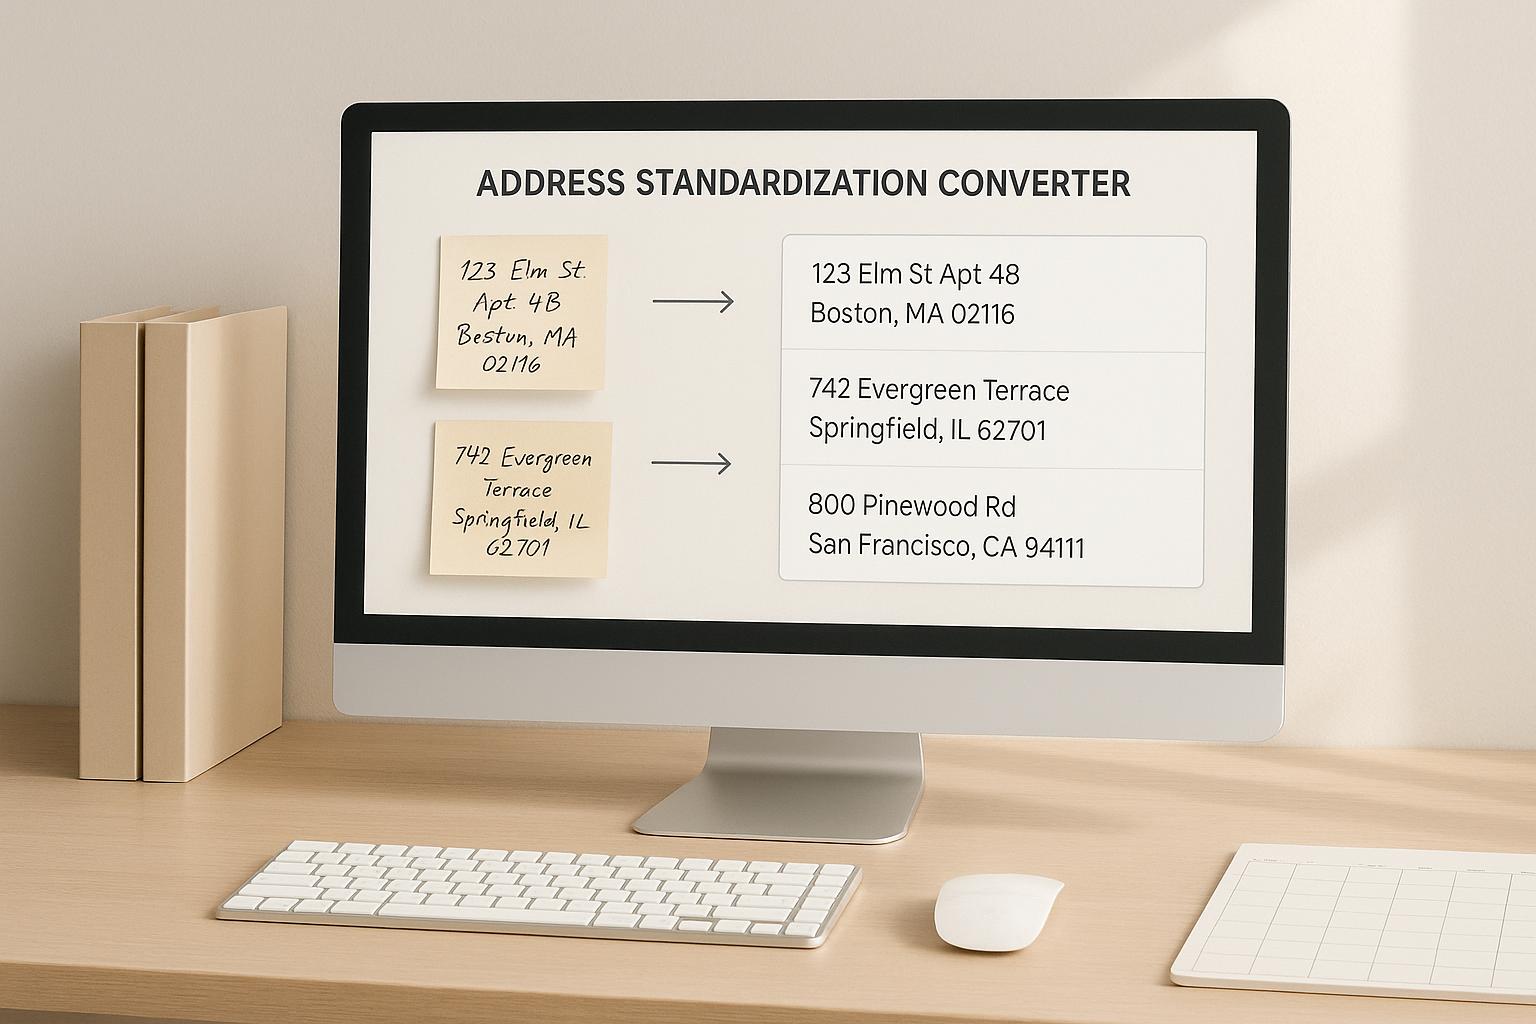
- Improved Accuracy: Standardized data input ensures clean, reliable information for analysis.
- Predictive Insights: Models forecast trends like price shifts, demand surges, or inventory changes using enriched property data.
This system requires integrating reliable data sources, setting up triggers, and using tools like low-latency APIs and cloud storage for seamless processing. The result? Faster decisions and a sharper competitive edge in a fast-moving property market.
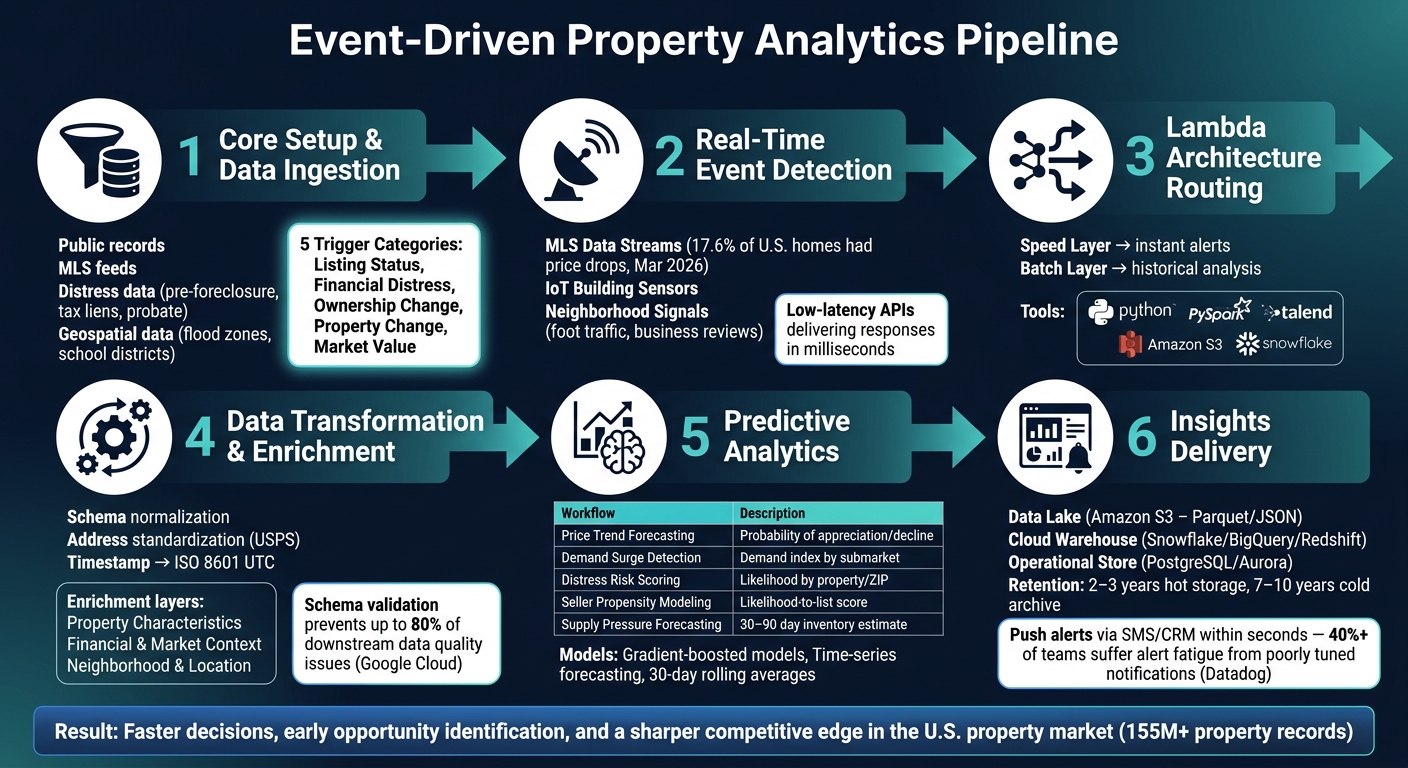
Event-Driven Property Analytics Pipeline: From Data Capture to Actionable Insights
Transforming the Real Estate Industry with Data and Predictive AI
sbb-itb-8058745
Core Setup and Prerequisites
To capture and analyze events effectively, you need to ensure your system has the right data inputs. This step is crucial because even minor mistakes here can disrupt all subsequent analysis.
Identifying Key Data Sources
A dependable event-driven system relies on multiple layers of data. The backbone includes public records, MLS feeds, and distress data such as pre-foreclosure notices, tax liens, probate filings, and bankruptcy records. To assess long-term risks, incorporate geospatial data like flood zone classifications, school district boundaries, and wildfire risk scores.
Maintaining clean data is non-negotiable. For example, inconsistencies like "Main St" versus "Main Street" can skew results. Standardizing address formats before data enters your pipeline ensures accuracy throughout the process.
Once your data sources are in place, the next step is defining the triggers that will activate real-time analysis.
Defining Event Triggers
Event triggers are specific conditions that kick off your analytics workflow. While obvious signals like new listings or price reductions are important, you should also focus on less apparent indicators. Signals like tax delinquencies, high-equity thresholds, or major repair permit filings can reveal seller intent weeks – or even months – before a property officially hits the market.
Each type of trigger corresponds to a particular business action:
| Trigger Category | Specific Event | Business Action |
|---|---|---|
| Listing Status | MLS status changes to "Active" | Screen for acquisitions or conduct competitive analysis |
| Financial Distress | Notice of Default or tax lien filed | Reach out proactively to a motivated seller |
| Ownership Change | Probate or divorce filing recorded | Signal for motivated seller; initiate contact workflow |
| Property Change | Major repair permit filed | Early indicator of a potential upcoming listing |
| Market Value | AVM estimate drops >10% in one quarter | Reassess asset performance and local market conditions |
For instance, setting a trigger for properties with estimated equity exceeding 40% can help identify candidates for cash-out refinance outreach.
Setting Up Access and Infrastructure
To enable real-time monitoring – like detecting a price cut or lien filing within seconds – real estate APIs are essential. These APIs can deliver responses in milliseconds. For larger-scale tasks, such as training machine learning models or analyzing historical data, bulk data delivery through cloud storage solutions like Amazon S3 or data warehouses such as Snowflake is more practical.
"Near-real-time is no longer a shiny demo burdened by operational overhead compared to batch; it’s now a functional necessity." – Ryan Arjun, BI Specialist
Platforms like BatchData offer pre-built APIs for property searches, data enrichment, and bulk data delivery. These tools can dramatically reduce setup time, allowing you to deploy a production-ready pipeline in days instead of months.
With the right infrastructure in place, your system will be ready to capture and process events as they happen.
Event Capture and Data Ingestion
Detecting Relevant Property Events
Real-time detection and routing are essential for event-driven analytics, especially when aiming to deliver predictive insights into market trends. Capturing impactful events as they happen requires choosing the right detection method for each signal type.
The most actionable property events typically originate from three main sources: real-time MLS data streams, IoT-enabled building sensors, and neighborhood-level signals. Here’s how each contributes:
- MLS Data Streams: These reveal real-time changes in property prices and inventory. For instance, in March 2026, 17.6% of U.S. homes experienced price drops – an increase from 16.0% the previous year.
- IoT Sensors: Devices measuring humidity, temperature, and drainage help predict and prevent maintenance issues like mold or water damage.
- Neighborhood Signals: Data such as foot traffic patterns, local business reviews, or nearby infrastructure developments provide insights into location desirability – offering a broader perspective than traditional metrics.
The table below links event types with their detection sources and analytics benefits:
| Property Event Type | Detection Mechanism | Analytics Value |
|---|---|---|
| Price Changes | MLS Data Streams | Market trend forecasting and competitive pricing |
| Inventory Shifts | Real-time Listing Feeds | Identifying supply/demand imbalances |
| Environmental Shifts | IoT Sensors (Humidity/Temp) | Predictive maintenance and mold prevention |
| Neighborhood Change | Foot Traffic/Business Reviews | Assessing location desirability and asset valuation |
While detection is crucial, its true value lies in the seamless flow of these signals into the analytics pipeline. This makes accurate and fast routing absolutely essential.
Routing Events into the Analytics Pipeline
Once events are captured, they need to be routed efficiently. A Lambda architecture is often employed to handle this process. It uses a speed layer for immediate event processing and a batch layer for historical data analysis. For example, a price drop can trigger an instant alert, while deeper market trends can be analyzed over time.
A practical case: In September 2024, a local housing provider teamed up with C5 Alliance to implement an IoT monitoring system using Microsoft Fabric and a Lambda architecture. Spearheaded by John Gamble, Director of Professional Services, this system processed live humidity and temperature data from multiple properties. Updates were delivered to a Power BI dashboard with sub-second latency. Tools like Python, PySpark, and Talend are frequently used to manage and transform such event flows.
Automation is key when scaling event ingestion. Cloud platforms can handle thousands of properties with minimal cost, removing delays and errors from manual processes. For inline data enrichment – such as adding owner contact details – services like BatchData offer specialized APIs.
"Agentic systems (autonomous AI agents that reason, plan, act, and loop) are active consumers. They thrive on fresh context to make timely decisions… Polling or stale batch data kills their reactivity." – Ryan Arjun, BI Specialist
With a reliable system for event ingestion and routing in place, the next step is transforming and enriching this data to extract actionable insights.
Stream Processing and Enrichment
Stream processing takes the raw signals collected by the event ingestion pipeline and refines them for deeper analysis. This step ensures data is not only clean but also enriched with valuable context.
Transforming and Validating Data
Data coming from MLS feeds, county recorders, and IoT sensors is often messy and inconsistent. To make it usable, transformations and validations are performed within milliseconds.
Key transformations include:
- Schema Normalization: Align fields like
list_priceandasking_priceto a unified format, such asasking_price_usd. - Address Standardization: Break down addresses into structured components following USPS guidelines for improved accuracy.
- Temporal Consistency: Convert all timestamps to ISO 8601 UTC, keeping local time zone metadata intact for reporting.
Address normalization often pairs with rooftop geocoding to translate addresses into precise latitude/longitude coordinates. This shift from block-level to parcel-level precision is crucial for tasks like geospatial risk modeling and neighborhood analysis.
Validation ensures data integrity in three key areas:
- Structural Checks: Confirm required fields like
property_id,event_type, andevent_timestampare present and correctly formatted. - Business Logic: Verify values make sense, such as ensuring prices are above $0 or
year_builtfalls between 1800 and the current year. - Cross-Field Consistency: Ensure fields like ZIP code, city, and state align with trusted reference databases. For example, a mismatch between a California state code and a Texas ZIP code should trigger a flag.
Critical failures, such as missing property_id, are quarantined, while minor anomalies are tagged with error flags for further review. Tracking these issues in a dedicated metrics topic provides a window into problematic sources and helps maintain data quality over time.
"A single bad data point can invalidate an entire analysis." – BatchData
Research from Google Cloud highlights the importance of this step, noting that schema validation during ingestion can prevent up to 80% of downstream data quality problems in streaming pipelines.
Once data is transformed and validated, the next step is enrichment – adding context to make the data actionable.
Enriching Property and Contact Data
Enrichment takes raw events and adds layers of context, turning them into insights ready for decision-making. For example, a price_change event can be enriched with details like price_per_sq_ft_diff_vs_neighborhood_median or the owner’s contact profile, revealing potential opportunities.
Enrichment typically happens through streaming joins, where validated events are read, processed through enrichment services, and then written to a new topic (e.g., enriched_property_events). This process adds value across three layers:
| Enrichment Layer | Example Attributes Added | Analytics Value |
|---|---|---|
| Property Characteristics | Bed/bath count, square footage, year built, zoning, parcel ID | Baseline valuation and physical profiling |
| Financial & Market Context | Assessed value, mortgage balance estimate, recent sale history, days on market | Underwriting, distress scoring, pricing models |
| Neighborhood & Location | Census tract, school district, walkability score, ZIP-level median sale price | Trend detection, gentrification signals, asset positioning |
For ownership and contact enrichment, tools like BatchData offer APIs tailored for this purpose. When a key event occurs – like a foreclosure notice or price drop – BatchData can append verified owner details, such as names, phone numbers, and mailing addresses, even when ownership is hidden behind LLCs or trusts.
To keep latency low, frequently used reference data (e.g., ZIP-to-neighborhood mappings or median sale prices) can be cached in-memory using tools like Redis. Real-time API calls should be reserved for dynamic attributes, like phone number validity. For more time-intensive enrichment tasks, asynchronous processing is a smart option: queue the event, attach enrichment results later, and then publish the final record to the enriched topic.
Finally, ensure compliance with regulations when using enriched contact data. Integrate checks for laws like TCPA, CAN-SPAM, FCRA, and privacy standards directly into the enrichment workflow to avoid legal risks.
Trend Detection and Predictive Signals
Identifying Market Trends
Once you’ve enriched your event data, the next step is to pinpoint market trends. The challenge lies in distinguishing real shifts from everyday fluctuations.
To uncover meaningful trends, combine various signals like median list price, days on market, inventory levels, price reductions, and absorption rates. For example, if price reductions climb by 20% over two to four weeks while days on market also increase, you’re likely witnessing a significant market shift.
Segmentation plays a critical role here. A citywide average can mask the nuances of specific neighborhoods or price ranges. By breaking down trends by ZIP code, property type, and price tier, you get a more precise view of local changes. Common benchmarks for these localized comparisons include monthly data from the National Association of Realtors (NAR) and Zillow‘s Home Value Index (ZHVI).
To refine your analysis further, use 30-day rolling averages and year-over-year comparisons (adjusted for seasonality). This approach eliminates predictable, short-term patterns – like weekend listing surges or monthly inventory resets – so you can focus on true market shifts.
Don’t overlook distress signals. Tracking foreclosure filings, notice-of-default records, or repeated listing failures – especially when they appear in geographic clusters – can reveal potential motivated-seller inventory before it becomes widely known. As BatchData explains: "The goal is not a crystal ball. It is to quantify uncertainty and identify the most probable outcomes, allowing investors to position themselves advantageously before a trend becomes obvious."
These detection methods lay the groundwork for generating forward-looking insights.
Generating Predictive Insights
Once trends are identified, predictive models can turn these patterns into actionable forecasts. While these models don’t guarantee outcomes, they provide probability estimates that help you anticipate market conditions.
Start with propensity modeling, using enriched event data to score potential outcomes. For instance, a property with tax delinquency issues, long ownership (10+ years), and high equity is statistically more likely to hit the market soon. When BatchData integrates verified owner contact information into these signals, outreach teams can act proactively – often before the property is listed publicly.
For forecasting price and demand trends, gradient-boosted models and time-series forecasting are ideal. These methods handle structured, sequential inputs effectively. Feature engineering should focus on event frequency, recency, and velocity. Adding macroeconomic inputs – like Freddie Mac‘s weekly Primary Mortgage Market Survey (PMMS) rates or U.S. Census Bureau building permit data – can improve the accuracy of supply and demand forecasts.
To ensure reliability, backtest models across a full market cycle. Evaluate performance metrics like precision, recall, and mean absolute error against holdout data. Compare these results to a simple moving-average baseline. If your advanced model doesn’t outperform the baseline, it’s not ready for deployment. Models should also be retrained regularly to adapt to changing conditions, with teams monitoring for shifts in event distributions.
Here’s a quick overview of predictive workflows, their key inputs, and expected outputs:
| Predictive Workflow | Key Event Inputs | Model Output |
|---|---|---|
| Price trend forecasting | Median list/sale price, days on market, inventory | Probability of price appreciation or decline |
| Demand surge detection | Showing activity, search volume, new listings | Demand index score by submarket |
| Distress risk scoring | Foreclosure filings, tax delinquencies, lien events | Distress likelihood by property or ZIP code |
| Seller propensity modeling | Ownership duration, equity estimate, life events | Likelihood-to-list score per owner |
| Supply pressure forecasting | Building permits, new listing velocity | Inventory estimate for the next 30–90 days |
Storage, Dashboards, and Alerting
Organizing Data for Historical Analysis
When predictive models generate actionable insights, having a solid storage setup ensures that data remains accessible for both immediate decisions and long-term analysis. A layered storage strategy is ideal for this purpose.
Start by storing raw event logs in a data lake like Amazon S3, using formats like Parquet or JSON. Complement this with a cloud data warehouse – such as Snowflake, BigQuery, or Redshift – for query-ready, curated tables that analysts and BI tools can easily access. For real-time updates, such as current listing statuses or owner contact details, an operational data store (e.g., PostgreSQL or Aurora) is essential.
Organize fact tables by event type: for example, property_price_events, listing_status_events, and ownership_events. These should be time-stamped and append-only. Pair them with slowly changing dimension tables for properties, owners, and geographic data. Monetary values should be stored as DECIMAL(18,2) (USD), and timestamps should use UTC with local zone metadata. This structure not only supports model recalibration but also enables trend analysis.
For data retention, keep two to three years of event data readily available in your data warehouse for everyday analytics. Older raw data can be moved to compressed cold storage solutions like S3 Glacier. However, summary tables – such as annual aggregates or rolling medians – should remain accessible for long-term trend analysis. For valuation or audit purposes, raw data stored in compressed Parquet format for seven to ten years is a reasonable standard. Tools like BatchData can simplify this process by populating foundational property dimension tables and keeping ownership and contact details up to date across both your data lake and warehouse.
Building Insights Dashboards
Once your data storage is in place, the next step is to transform raw data into actionable insights through dashboards. A well-designed dashboard distinguishes between operational views (real-time updates) and analytical views (long-term trends). Focus on five to eight high-impact KPIs – such as median list price, active inventory, days on market, price reductions, and absorption rate. From there, users can navigate to more detailed dashboards categorized by region, property type, or event type.
Dashboards should be tailored to different audiences. For instance, investors may benefit from map views, analysts from time-series panels, and brokers from pipeline metrics. Geo heat maps, color-coded by price changes or inventory stress, can quickly highlight regional trends. While dashboards tracking over 200 KPIs are technically achievable, prioritizing clarity and usability is crucial to avoid overwhelming users.
Setting Up Alerts for Key Events
Dashboards are great for on-demand insights, but alerts are critical for immediate action. Think of dashboards as a pull system – users check them when needed – while alerts act as a push system, delivering information the moment it becomes relevant. Examples of key alerts include sudden price drops, new listings that meet specific criteria, ownership changes, and major inventory shifts.
To prevent alert fatigue, use a combination of static thresholds and anomaly detection. High-priority alerts should be routed through SMS or push notifications, complete with enriched property records for full context. A Datadog survey revealed that over 40% of engineering teams experience alert fatigue due to poorly tuned notifications, which can undermine trust in the system. By delivering enriched alerts directly into tools like CRMs, teams can act on critical information within seconds instead of hours. BatchData’s real-time API integration enables this seamless flow of enriched alerts.
"We want to supplement your work and make you superhuman so you can do things in seconds not hours. That’s where BatchData comes in. What used to take 30 minutes now takes 30 seconds." – Chris Finck, Director of Product Management
Conclusion: Getting the Most from Event-Driven Property Analytics
Event-driven analytics thrives because it ensures your team works with up-to-date information rather than outdated snapshots. The process outlined in this guide follows interconnected stages, each building on the last. But remember – an alert is only as effective as the enriched and validated event that triggers it.
This method combines speed with context. A raw event – like a price drop, a status update, or a new lien filing – only tells you what happened. When paired with essential property and owner details, your team can act quickly and decisively. This ability to bridge the gap between detection and response is where businesses gain an edge in the competitive U.S. property market.
To maximize impact, start small and validate as you go. Focus on one or two high-value triggers – like new listings with price reductions over 5% within a week or ownership changes in specific ZIP codes. Build a simple pipeline around these triggers and ensure your event capture is consistent, enrichment is accurate, and alerts are driving actionable decisions. Once you’ve proven value, you can expand your scope without wasting resources on unnecessary infrastructure.
Platforms like BatchData make scaling this process much easier. With nationwide property coverage across 155 million+ records, BatchData offers flexible delivery options – whether through low-latency REST APIs or bulk files via Snowflake and Amazon S3. Whether you’re enriching data for a real-time pipeline or updating a nightly warehouse, BatchData reduces the engineering workload of managing high-quality property and contact data. This frees your team to focus on making strategic decisions.
"The question has shifted from, ‘Is this a good deal?’ to ‘What does the data say about this deal’s risk, potential, and portfolio fit?’" – BatchData
Event-driven property analytics isn’t a one-and-done initiative. It’s an evolving process. Regularly review which events and alerts are delivering results, cut out ineffective ones, and fine-tune your enrichment strategy as your needs grow. This ongoing refinement mirrors the pipeline’s journey – from capturing real-time events to generating actionable insights. Teams that embrace this cycle of improvement are better equipped to uncover valuable deals, manage risks effectively, and stay ahead of market changes. By doing so, they solidify their competitive advantage in a fast-moving industry.
FAQs
What’s the simplest first trigger to start with?
Monitoring real-time property transactions or pre-foreclosure data is one of the simplest ways to kick off event-driven analytics in property insights. These sources act as immediate indicators of market activity and emerging trends. By setting up triggers to capture new transactions or pre-foreclosure notices, you can quickly spot changes in market conditions and property values. This creates a solid starting point for building a reliable analytics framework.
How do I keep property event data accurate in real time?
To keep your property market data accurate and current, rely on trigger-based updates that respond immediately to changes. These triggers can monitor events like property transactions, foreclosures, or permit updates, ensuring your data stays fresh and relevant.
Using advanced tools such as APIs and cloud-based systems makes it easier to synchronize updates efficiently. Additionally, implementing regular processes for data enrichment and verification helps maintain both reliability and accuracy, giving you consistent, up-to-date insights.
How fast do alerts need to be to help decision-making?
Alerts need to be prompt to deliver insights that can lead to action, particularly in the fast-moving world of property markets. Real-time or near-real-time alerts work best, as they allow for swift reactions to changes or opportunities. The goal is to notify stakeholders within minutes or hours, giving them the chance to act before major market shifts take place. This timeliness can be a game-changer for property investments or market evaluations, helping to maintain a competitive edge.