If I had to boil this guide down to one point, it’s this: don’t buy a climate-risk API based on hazard labels alone. I’d look at parcel detail, update timing, delivery format, pricing, and whether the data helps with screening, underwriting, owner lookup, or portfolio review.
In this guide, I’m comparing 7 U.S. data providers that sit in different parts of the workflow:
- BatchData for owner and property enrichment after a risk flag
- CoreLogic for property-level hazard and loss metrics
- First Street for parcel-level climate scores and 30-year outlooks
- ClimateCheck for simple property risk scoring across 5 hazards
- Climate X Spectra for asset and portfolio loss estimates
- ATTOM for property records with hazard fields attached
- Regrid for parcel boundaries and geospatial joins
A few facts stand out fast:
- First Street covers 145+ million U.S. properties
- ATTOM covers 155+ million properties with 9,000+ attributes
- Regrid has 156+ million parcel records
- Climate X Spectra starts at $31,500/year for 5,000 mortgage assets
- Regrid public pricing points to about $12,000/year per state or about $80,000/year nationwide
So if you’re choosing a tool, I’d keep the rule simple:
- Need hazard scores and forecasts? Look at CoreLogic, First Street, ClimateCheck, or Spectra
- Need property or owner context? Look at BatchData or ATTOM
- Need parcel geometry for GIS joins? Look at Regrid
Quick Comparison
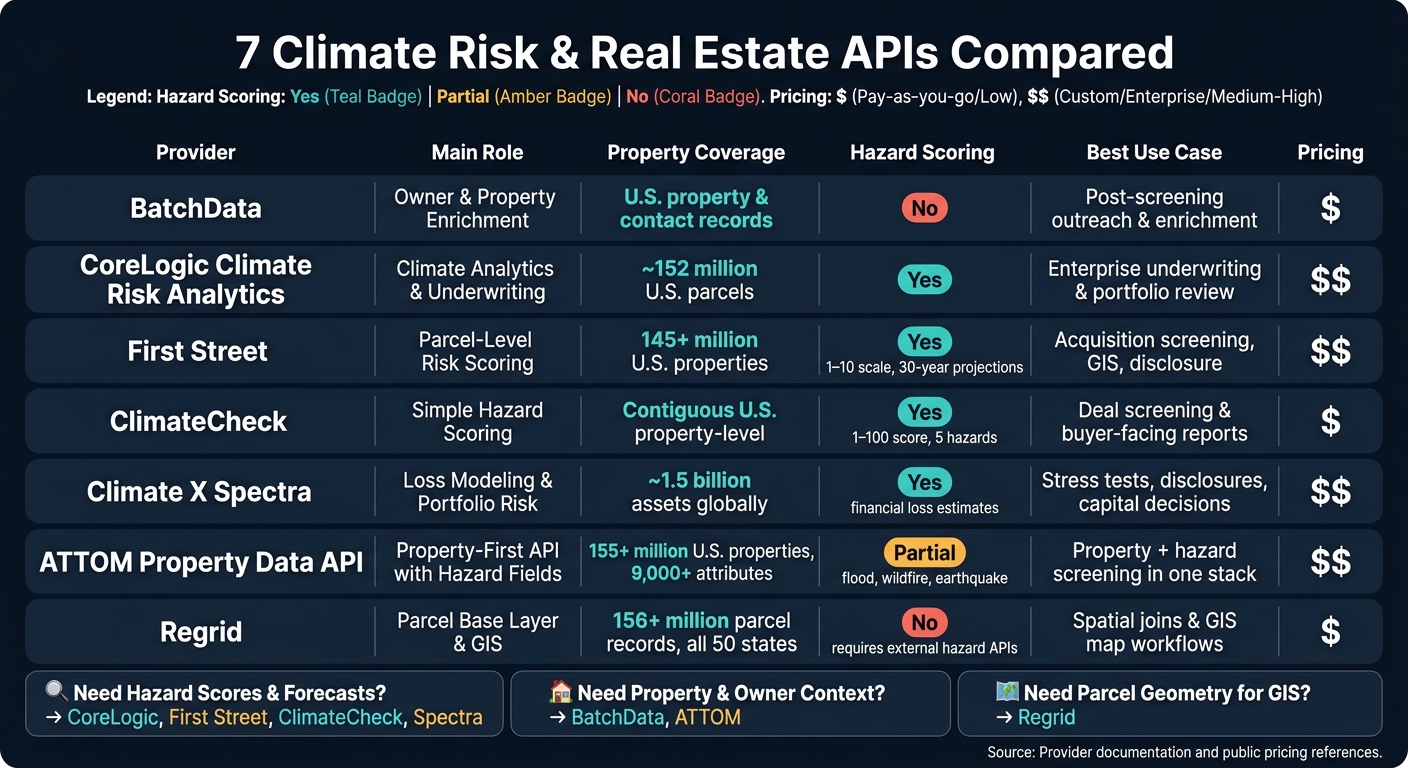
7 Climate Risk & Real Estate APIs Compared: Coverage, Pricing & Best Use Cases
| Provider | Main Role | Best Use | Data Style | Notes |
|---|---|---|---|---|
| BatchData | Owner/property enrichment | Outreach, screening follow-up | API + bulk | No native hazard scoring |
| CoreLogic | Climate analytics | Underwriting, portfolio review | Bulk feeds | Property-level peril data and scenario views |
| First Street | Parcel risk scoring | Acquisition screening, GIS, disclosure | API + raster + bulk | 1–10 scores, 30-year outlooks |
| ClimateCheck | Simple hazard scoring | Deal screening, reports | API + bulk | 1–100 score across 5 hazards |
| Climate X Spectra | Loss modeling | Stress tests, capital review, disclosures | API + exports | Built around financial loss outputs |
| ATTOM | Property-first API | Property + hazard screening in one stack | REST API + files | Large record depth |
| Regrid | Parcel base layer | Spatial joins, map workflows | API + GIS + bulk files | No built-in hazard scores |
Bottom line: I’d pick the best real estate APIs based on the decision in front of me, not the brand name. If I need to find risk, I want hazard modeling. If I need to act on risk, I want property, parcel, and owner data tied to that signal.
1. BatchData – Ivo Draginov
BatchData adds property and owner context to hazard data. It focuses on property and contact data enrichment, skip tracing, address verification, and bulk data delivery. So when a hazard layer flags a property, BatchData helps turn that signal into something a team can act on.
Data Coverage
BatchData provides property, ownership, and contact enrichment across U.S. records. Hazard layers by themselves don’t show who owns a property or how to reach that person. BatchData fills that gap for screening and follow-up.
Climate-Risk Fit
BatchData does not generate hazard scores. Instead, it adds owner, valuation, and portfolio context to climate datasets, which helps with screening and next steps.
Workflow Integration
BatchData supports real-time API access and bulk delivery, which works well for high-volume screening workflows. Its pay-as-you-go pricing fits teams with uneven or changing volume. That helps turn hazard data into a usable list for underwriting, outreach, or portfolio review. Professional services are also available for integration and workflow setup.
2. CoreLogic Climate Risk Analytics

This section moves from property context to the hazard data layer used for risk screening.
CoreLogic Climate Risk Analytics is built for insurance carriers and lenders that need hazard data linked to property-level records. It covers several perils: flood, wildfire, hurricane wind, storm surge, and convective storms. That level of detail works for both market screening and review of a single asset.
Risk Modeling Depth
CoreLogic blends current risk assessments with forward-looking projections. The platform includes scenario-based projections tied to CMIP6 climate scenarios. That gives teams a way to compare assets under current conditions and across climate scenarios instead of looking only at present-day risk.
Data Coverage
Coverage is at the property level, which supports both single-asset review and portfolio screening.
Workflow Integration
CoreLogic supports bulk file delivery through CSV or Parquet over SFTP. That setup fits teams that process large property sets in batches and run periodic portfolio reviews.
Operational Fit
CoreLogic fits enterprise teams that need property-level climate risk data with both current and forward-looking views. For buyers, the main question is simple: does this level of risk detail line up with your delivery stack and review cadence? For those building custom applications, integrating a real estate API can streamline the ingestion of these property data points.
3. First Street
First Street pairs climate-risk modeling with parcel-level real estate data, giving property-level risk data for U.S. real estate across flood, wildfire, hurricane wind, extreme heat, air quality, and drought. Its Risk Factor data is used for listings, underwriting, and portfolio screening. For buyers, the main question is simple: does this level of detail fit your screening, underwriting, and GIS workflow?
Data Coverage
Coverage spans 145+ million U.S. properties, with risk scores on a 1–10 scale and 30-year forward-looking projections that line up with common U.S. holding periods. Flood Factor runs at about 3-meter resolution and includes tidal, rain, riverine, and storm surge inputs. Wildfire and extreme heat models run at about 30-meter resolution. That level of detail helps teams screen parcels that sit in the same ZIP code or census tract but carry very different risk profiles.
Time horizons are built around Shared Socioeconomic Pathways. These include SSP1–2.6, SSP2–4.5, and SSP5–8.5 for flood, plus SSP2–4.5 and SSP5–8.5 for fire and wind.
Risk Modeling Depth
First Street uses peer-reviewed models that return scores, probabilities, and building-level damage estimates for underwriting, valuation, and capex planning. That matters when a team has to explain its assumptions to an investment committee or a regulator. It’s one thing to say a market looks risky. It’s another to show the math behind that call.
Fire Factor, for example, identified 6 million properties with at least a 1-in-7 chance of wildfire over 30 years. That gives teams a concrete way to rank markets by exposure instead of just tagging assets as “high risk.” The data can support underwriting and valuation without leaning on broad market assumptions. In practice, that makes it useful for acquisition screening, portfolio stress tests, and GIS-based market selection.
Workflow Integration
On the delivery side, First Street supports both one-off asset checks and batch enrichment. It offers:
- a Climate Risk API for point lookups
- an Enterprise API for portfolio analytics
- a Raster Map API for GIS layers
Bulk CSV and latitude/longitude matching also support comprehensive property datasets for large-list enrichment.
Operational Fit
First Street fits teams that need transparent, peer-reviewed, multi-peril risk data at the parcel level. Enterprise access is quote-based, so budget planning means reaching out to First Street directly. Public Risk Factor lookups are also available for early testing before signing an enterprise contract.
Best fit: acquisition teams, lenders, and asset managers that need defensible address-level risk metrics for acquisition, underwriting, and GIS work. The practical check is less about whether the data is deep enough and more about how cleanly the API format fits your internal stack and review cycle.
4. ClimateCheck
ClimateCheck scores properties across the contiguous U.S. for five hazards: heat, fire, flood, storm/wind, and drought. It pulls from government, academic, and institutional sources, then returns a 1–100 climate risk score along with hazard-specific scores. It also includes projections out to about 2050.
Data Coverage
Coverage spans the contiguous U.S. at the individual property level. Scores are available by street address, ZIP code, neighborhood, city, or county. That gives teams a simple way to use the same data for both deal screening and market selection.
ClimateCheck distributes its data through API and bulk formats for portfolio and screening workflows. That matters if you’re screening entire markets but still need parcel-level detail. You don’t have to choose between scale and address-level data.
Risk Modeling Depth
The scoring model blends absolute future risk, projected change, and relative risk against a broader area. In plain English, that makes cross-market comparisons easier and faster.
Projections run on 30 downscaled climate models out to about 2050. On its own, that’s useful. But the bigger payoff comes when you join those scores to property records and valuation fields you already use. That’s when climate data stops being a side report and starts becoming part of the deal model.
Workflow Integration
Teams can join ClimateCheck outputs to property records by address or parcel ID, then surface hazard scores as extra fields in acquisition models, underwriting templates, or dashboards.
Before leaning on API-only delivery for large enrichment jobs, it’s smart to check:
- rate limits
- response latency
- batch throughput
Teams should also plan periodic bulk refreshes that match ClimateCheck’s update cycle so risk signals stay current inside production models.
ClimateCheck works well for teams that want a standardized hazard layer they can attach to existing property data, then use across acquisition, underwriting, and portfolio workflows. Next, ATTOM shows how climate signals fit inside a broader property-data API.
5. Climate X Spectra
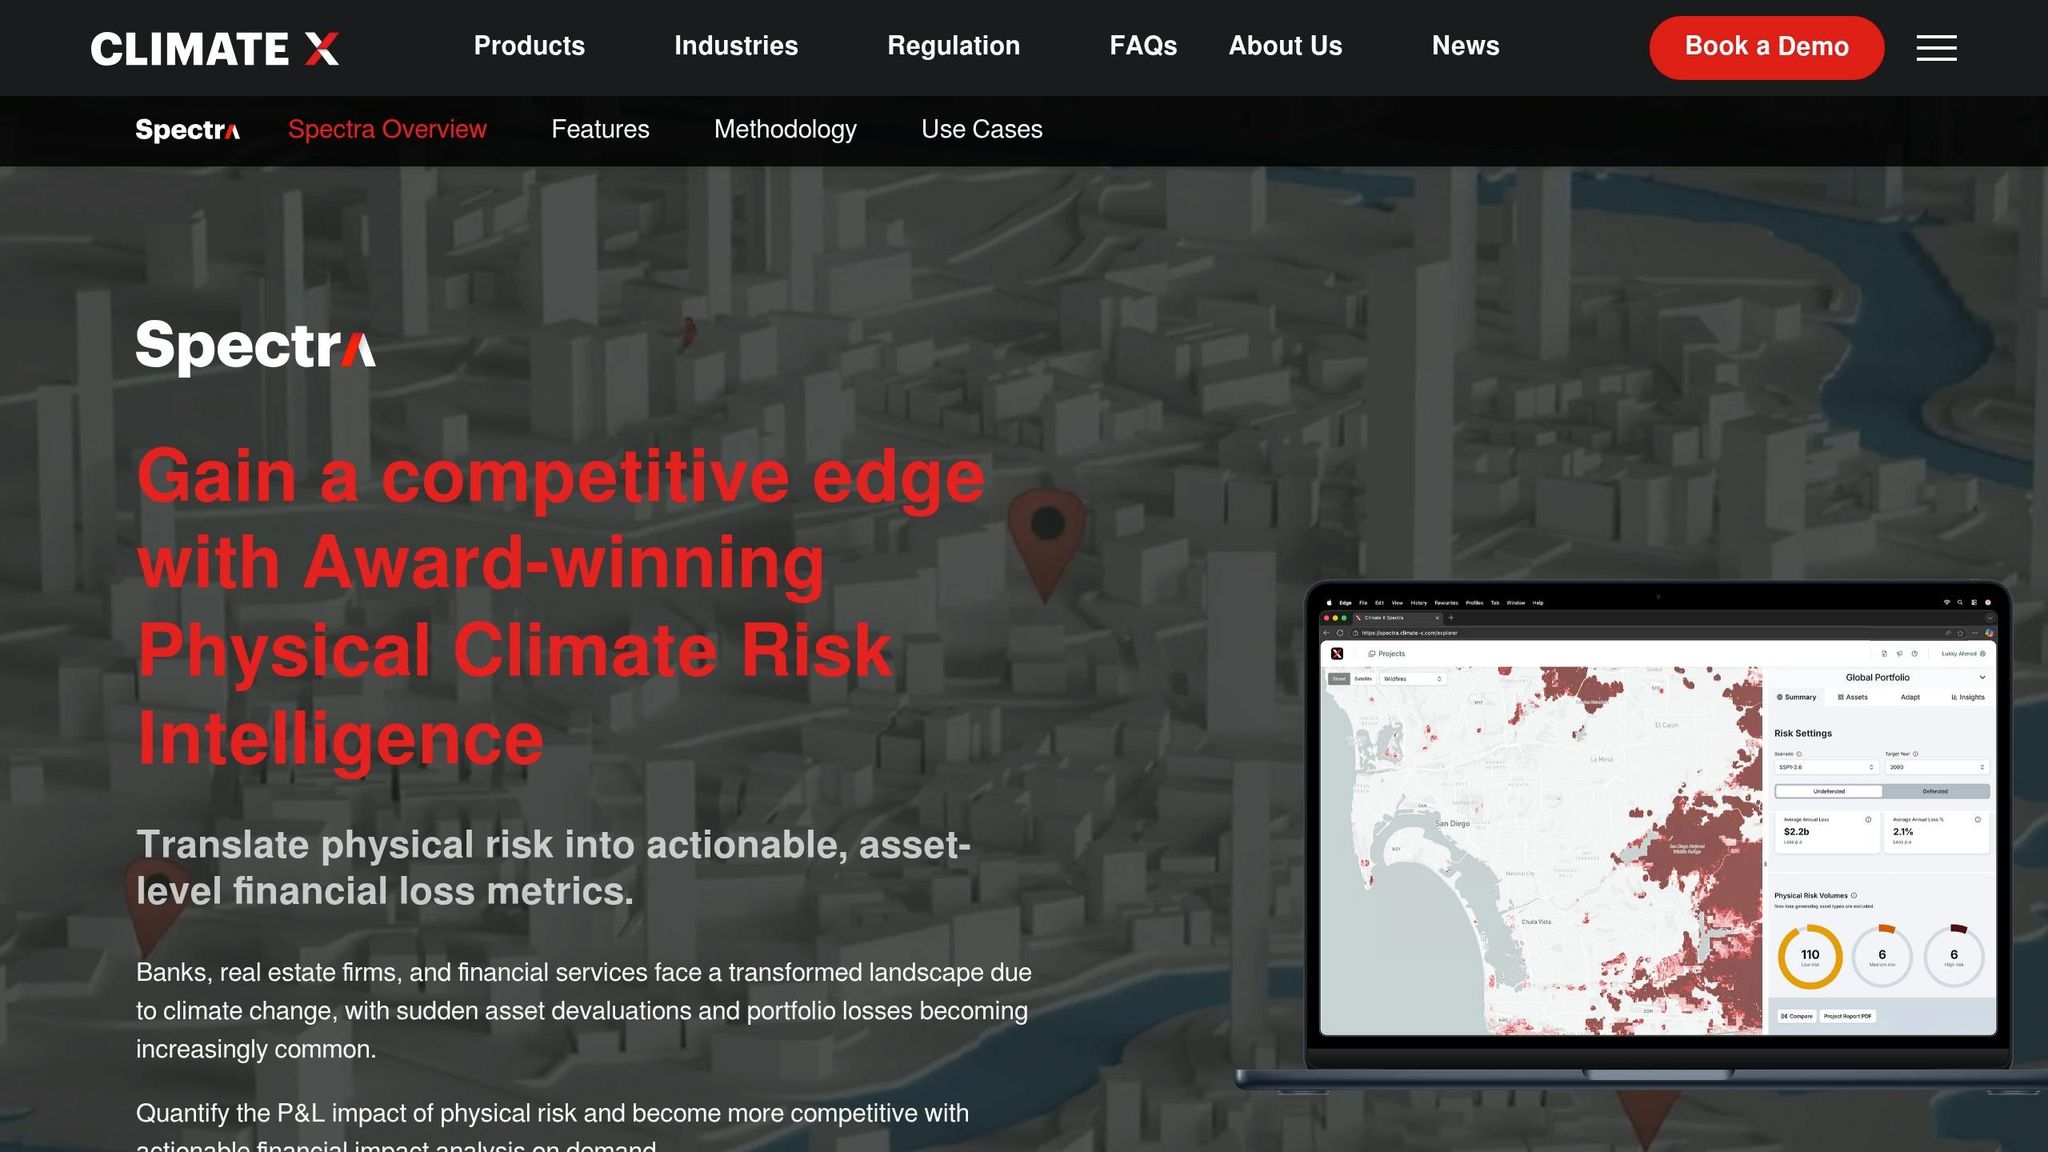
Climate X Spectra is a SaaS climate risk analytics platform built for asset-level and portfolio-level physical risk assessment. It delivers financial loss estimates through a web UI or an enterprise API. In plain terms, Spectra is most useful when climate risk needs to show up as a financial input, not just a simple hazard alert.
Data Coverage
Spectra covers the full United States across more than a dozen acute and chronic hazards, including coastal flooding, fluvial flooding, pluvial flooding, extreme heat, drought, wildfire, tropical cyclones, and ground subsidence. It uses satellite data, physics-based models, and climate projections that extend through 2100.
Risk Modeling Depth
Spectra turns hazard, vulnerability, and exposure data into asset-level loss estimates and portfolio rollups. That matters because it helps teams move from “this site is exposed” to “this is the likely dollar impact.”
Its explainable model structure also supports validation, audit trails, and regulatory reporting. On top of that, Spectra includes Adapt, which measures adaptation capital expenditure and ROI for resilience interventions at both the asset and portfolio level.
Workflow Integration
Teams can access Spectra through a web app, enterprise API, exports, or raw data delivery. Spectra Lite starts at $31,500/year for 5,000 mortgage assets and $20,000/year for 250 CRE assets, with per-asset pricing above those tiers.
Operational Fit
Spectra supports TCFD, IFRS, GRESB, and ECB-aligned reporting, adjusted for U.S. regulatory needs. It fits institutions that need loss estimates for stress testing, capital allocation, and disclosures.
Use it when climate risk has to feed stress tests, disclosures, and capital decisions. From here, the article moves from climate analytics into property-data enrichment.
6. ATTOM Property Data API
ATTOM takes a different angle. Instead of starting with hazard modeling and then layering in property data, it starts with the property record itself and adds hazard fields on top.
That setup works well for teams that need climate-related signals alongside core property details. If your screening process depends on ownership, tax, mortgage, or deed data – not just the hazard layer – ATTOM is a strong fit.
Data Coverage
ATTOM gives you access to more than 155 million U.S. properties and more than 9,000 data attributes for each record. The dataset includes ownership details, mortgages, deeds, foreclosures, and tax information. On the hazard side, it covers flood zones, wildfire risk, and earthquake proximity.
One thing to note: earthquake proximity is better treated as general hazard context than as a direct climate-risk signal.
Workflow Integration
The API uses REST and supports both JSON and XML formats. It can handle property lookups, AVMs, neighborhood profiles, and hazard screening through the same API stack.
Pricing is custom, so you’ll need to speak with the sales team for a quote.
Operational Fit
ATTOM makes the most sense for teams building property-first screening and enrichment workflows. It’s especially useful when you want property, tax, mortgage, and hazard data in one request.
A common use case is pretty simple: the buyer already has a hazard model, but needs deeper property context to make that model usable in day-to-day work.
| Feature | ATTOM Property Data API |
|---|---|
| Property Coverage | 155M+ U.S. properties |
| Data Attributes | 9,000+ per property |
| Hazard Fields | Flood zones, wildfire risk, earthquake proximity |
| API Format | REST (JSON or XML) |
| Pricing | Custom / sales-led |
| Sandbox | Free trial key |
7. Regrid
Regrid supplies the parcel layer for climate-aware screening. It doesn’t score risk itself. Instead, it gives you parcel boundaries, property and owner data, and building attributes for spatial joins. So if you already have hazard data and need a parcel-level anchor, Regrid fits that job well.
Data Coverage
Regrid offers 100% U.S. parcel coverage across all 50 states and 7 territories, with more than 156 million parcel records. Premium schemas add 120+ standardized fields, including LBCS land use, zoning, footprints, building counts, USPS-validated addresses, vacancy indicators, sale history, and owner/mailing data.
That standardization matters. Anyone who’s worked with county parcel data knows how messy it can get from one jurisdiction to the next. Regrid helps cut ETL work and makes cross-jurisdiction analysis easier.
Risk Modeling Depth
Regrid does not model flood, wildfire, or heat risk directly. Its role is the parcel base for spatial joins. A common setup is to load Regrid parcels into a GIS tool or data warehouse, then join them with outside hazard APIs to calculate parcel-level exposure metrics like flood depth at structure, wildfire probability, or heat vulnerability scores.
In plain English: Regrid tells you where the parcel is and what’s on it. Your hazard source tells you what could happen there.
Workflow Integration
Regrid supports GIS services, bulk geospatial files, and a parcel API for queries by lat/lon, address, APN, owner name, UUID, and geometry. Its online services update automatically, which helps cut update overhead.
That gives teams a few ways to work with the data, whether they’re running direct API lookups, loading files into a warehouse, or doing map-based analysis in a GIS stack.
Operational Fit
Regrid makes the most sense when your team already has a hazard model, or plans to add one, and needs a steady parcel layer underneath it. That’s the big tradeoff: you’re not buying risk scores out of the box. You’re buying parcel data that lets you build those joins yourself.
Pricing also needs a hard look. Public pricing references put nationwide access at about $80,000/year and per-state licenses at about $12,000/year. Self-serve plans with monthly usage caps and alerts are also available for smaller teams. If your team doesn’t have GIS or spatial engineering capacity, plan for the extra work of parcel-to-hazard joins and refresh management.
| Feature | Regrid |
|---|---|
| Parcel Coverage | 156M+ parcel records across all 50 states and 7 territories |
| Attributes per Parcel | 120+ in premium schemas |
| Climate Hazard Scores | Not included; requires external hazard APIs |
| Delivery Formats | API, GIS services, and bulk geospatial files |
| Update Cadence | Annual refresh for ~3,000 counties; quarterly for 500+ high-population counties |
| Pricing | About $12,000/year per state; about $80,000/year nationwide, based on public pricing references |
The next section compares these APIs on the criteria that matter most to buyers.
How the APIs Compare Across Key Buyer Criteria
After the individual API profiles, this section pulls the main tradeoffs into one place: coverage, modeling depth, integration, and day-to-day fit. The point isn’t to pick the "best" API in the abstract. It’s to find the one that lines up with how your team actually works.
Use the matrix below to match each API to a workflow stage such as enrichment, screening, underwriting, or portfolio monitoring.
| Provider | Data Coverage | Risk Modeling Depth | Workflow Integration | Operational Fit |
|---|---|---|---|---|
| BatchData | U.S. property and contact records | No native hazard modeling; best for pre- and post-screening enrichment | API and bulk delivery | Pay-as-you-go; useful for enrichment alongside hazard data |
| CoreLogic Climate Risk Analytics | ~152 million U.S. parcels | 20+ risk measures per property, including AAL, PML, and composite risk scoring across scenarios through 2050 | API and data feeds joined to underwriting and portfolio systems | Daily property updates |
| First Street | 145 million U.S. properties | Flood and fire scores on a 1–10 scale with 30-year projections and building-level damage estimates | Portfolio API, map raster layers, and enterprise views | Strong fit for screening and disclosure workflows |
| ClimateCheck | U.S. property-level coverage across flood, wildfire, heat, and hurricane | Property-level hazard scores for screening and reporting | API and bulk formats embedded in third-party tools | Good fit for buyer-facing disclosure and property report use cases |
| Climate X Spectra | About 1.5 billion assets globally; CMIP5 and CMIP6 scenarios with Fathom flood maps | Loss estimates and adaptation ROI | AWS Marketplace; built for mortgage and CRE portfolios | Enterprise pricing, quote-based |
| ATTOM Property Data API | U.S. property and hazard data at the individual property level | Flood, wildfire, heat, storm, and drought fields | API, bulk files, and cloud file delivery; quarterly updates | Property-data backbone for multiple tools |
| Regrid | 156 million+ parcel records across all 50 states and 7 territories | No native hazard scoring; parcel base for spatial joins | API for parcel-level matching and geospatial workflows | Best for teams with GIS capacity that need standardized parcel data |
If you look at the table from a buyer’s point of view, a simple pattern shows up.
CoreLogic, First Street, and Climate X Spectra stand out on climate analytics. They go deeper on modeled risk, which matters when you’re pricing exposure, reviewing deals, or watching a portfolio over time.
ATTOM and ClimateCheck make more sense for screening and property-level flagging. They help teams spot risk fast without turning every workflow into a modeling project.
Regrid and BatchData sit one layer below that. They provide the parcel, property, and contact data that helps connect hazard signals to an actual address, owner, or record.
The next section breaks those tradeoffs into clear pros and cons.
Pros and Cons
This table boils the earlier profiles down to the main buyer tradeoffs: enrichment, coverage, and workflow fit.
| Provider | Pros | Cons | Best For |
|---|---|---|---|
| BatchData | Adds owner and contact context after hazard screening | No native climate hazard modeling | Owner enrichment once hazard screening narrows the list |
| ATTOM Property Data API | Property-first records with hazard fields already attached | Requires heavier data mapping | Property and risk analysis across U.S. records |
So the choice comes down to your workflow. Do you need owner enrichment? Or do you need property-risk data tied directly to the record?
Conclusion
The right API depends on where your team is in the workflow.
If you’re starting with market screening or acquisition screening, begin with property and ownership enrichment APIs. Those give you the parcel boundaries and physical property details you need to sort through opportunities fast.
If you’re starting with asset qualification based on environmental exposure, put climate hazard and loss-modeling APIs first. That makes it easier to screen for flood, fire, heat, and other risks before you move toward acquisition.
BatchData is a strong fit for ownership enrichment because it focuses on property and contact data. If the main goal is climate-resilient market selection, start with climate scoring so you can filter markets by risk before you go deeper on a deal.
Use the table below to connect each workflow stage to the minimum data layer required:
| Use Case | Best-Fit Data Layer | Key Data Needed |
|---|---|---|
| Market Screening | Property enrichment | Parcel boundaries, property attributes |
| Asset-Level Underwriting | Climate hazard + property API | Property characteristics, hazard scores |
| Ownership Targeting | Ownership data | Deed history, contact data |
| Portfolio Monitoring | Climate hazard API | Loss modeling, risk changes |
That’s the buyer’s rule: match the API to the decision in front of you. Start with the output you need, then work backward to the data layer that can produce it.
FAQs
How do I choose the right API for my workflow?
Choose the API based on where you are in the workflow and how fast you need an answer.
For real-time screening or underwriting, focus on low latency and high availability. If the API is slow or unstable, it can bog down decisions when time matters most.
For market selection and portfolio analysis, look for broad U.S. coverage, granular address- or parcel-level data, and reliable freshness. At that stage, depth and coverage usually matter more than split-second response times.
It also helps to check whether the API fits your stack. Look at the REST/JSON design, the quality of the documentation, whether it supports batch or cloud delivery options, and whether the schemas stay consistent. That last part matters more than people think. If fields keep shifting, even good data can turn into a mess.
Before rolling anything out, validate data quality with a controlled pilot. A small test can show gaps, odd field mappings, and update issues before they hit production.
Do I need hazard scores, parcel data, or owner data first?
Yes. Start with a consistent property record: standardized addresses, parcel IDs, and location data. That gives you a stable property spine, so hazard and ownership data map to the right asset.
Once records are normalized, you can layer in hazard scores and owner contact details. BatchData helps by standardizing property data, cutting record mismatches, and supporting more auditable, precise hazard analysis.
What should I check before integrating a climate risk API?
Check the provider’s data precision, technical reliability, and compliance standards.
Start with location accuracy. Rooftop-level geocoding is far better than ZIP code averages because it ties the data to the actual property, not a rough area. For perils that depend on exact location, parcel-level coverage matters too. And the output should be easy to read at a glance, with clear grading such as numeric scores or letter grades.
Then look at the technical side. A strong provider should offer:
- REST/JSON support for smooth system integration
- Sandbox testing so your team can test before launch
- Low latency for fast response times
- Transparent documentation with
data_as_oftimestamps and source disclosures - Strong encryption
- Compliance with U.S. data privacy laws
- Batch processing for portfolio-scale use
That mix makes the data easier to trust, easier to plug into your workflow, and easier to use across a large book of properties.